


The European chemical industry represents around 635 billion euro in turnover and is an essential element of most everyday products. The EU27 chemical industry, encompassing base, specialty, and consumer chemicals, is vital to the European economy, supplying diverse sectors and employing 1.2 million people. The chemical industry is a major supplier to key sectors such as automotive, construction, electronics, agriculture, pharmaceuticals, healthcare, and personal care – highlighting its fundamental role in European industrial value chains. The specialty chemicals and petrochemicals sub-segments contribute to more than half of chemical sales.
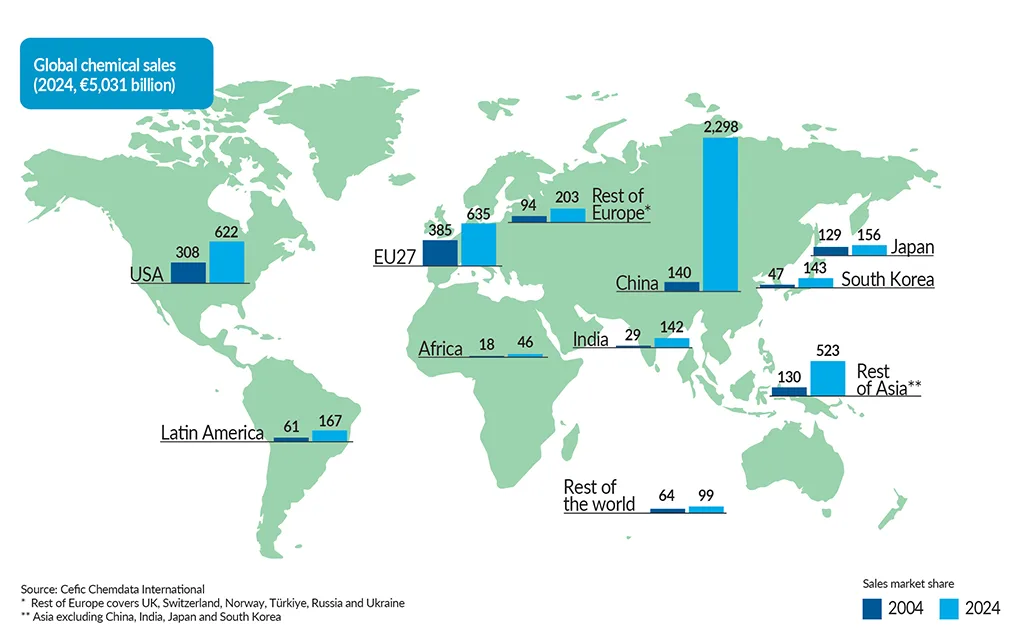
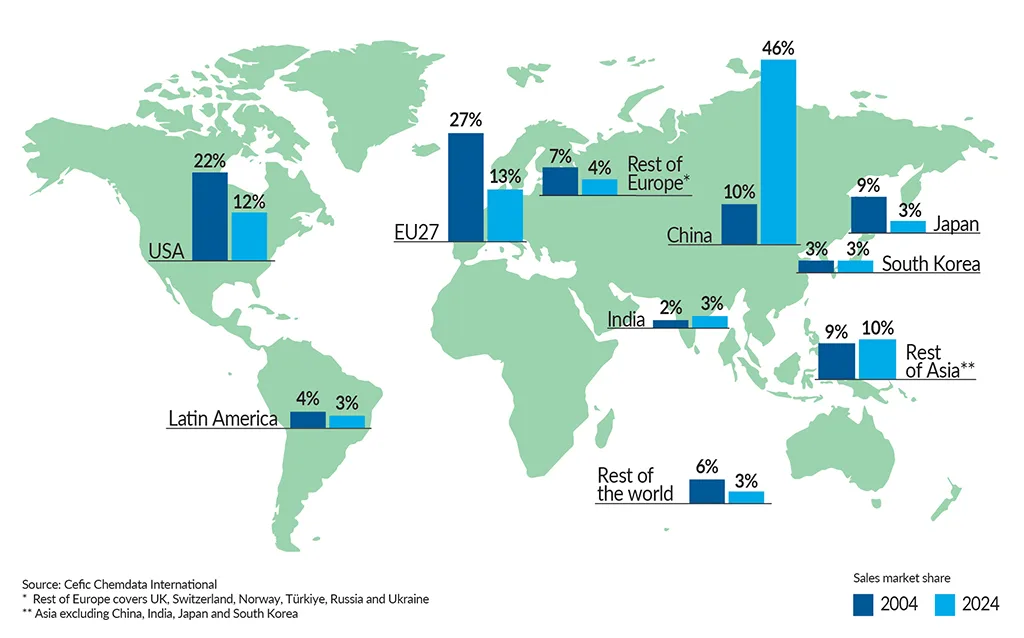
The industry faces increasing challenges due to China’s dominance, holding 45% of global sales and driving the majority of investments from the global chemical industry. Europe’s market share on the global chemical market has declined by 8 percentage points over the past 15 years, from 21% to 13% between 2009 and 2024 in nominal sales. In contrast, China grew its global market share from 24% to 46% over the same period.
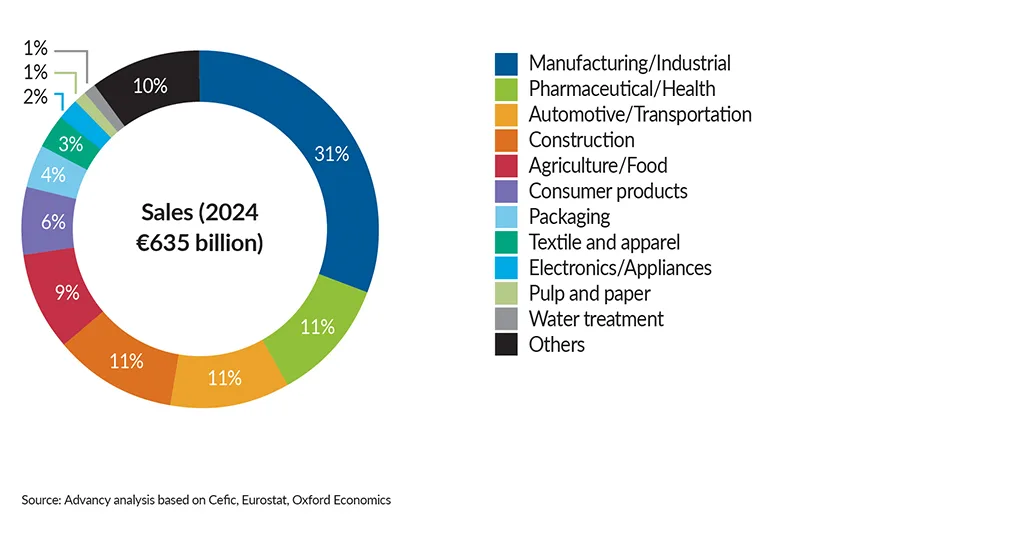
The chemical industry is a major supplier to key manufacturing sectors
Chemical sales in Europe by end market (2024)
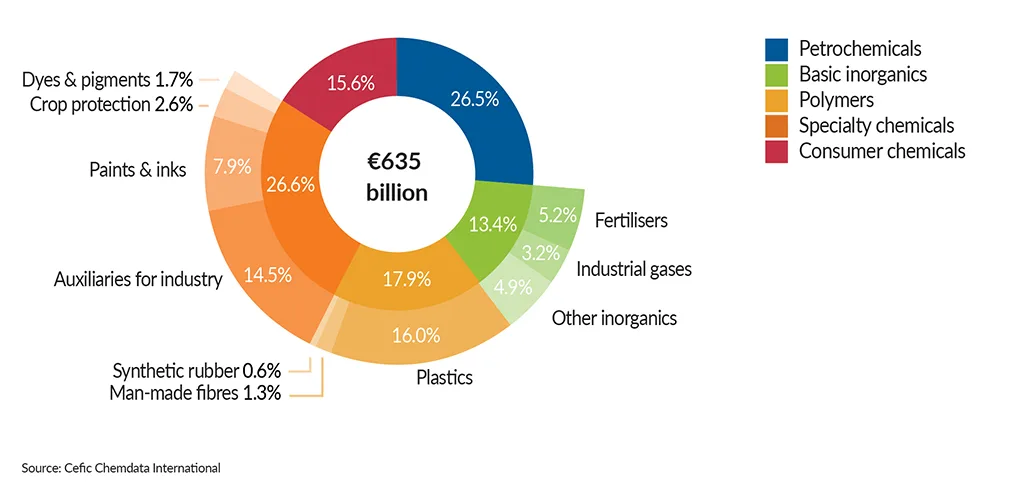
Petrochemicals and specialties account for more than half of EU27 chemical sales
EU27 chemicals sales (2024)
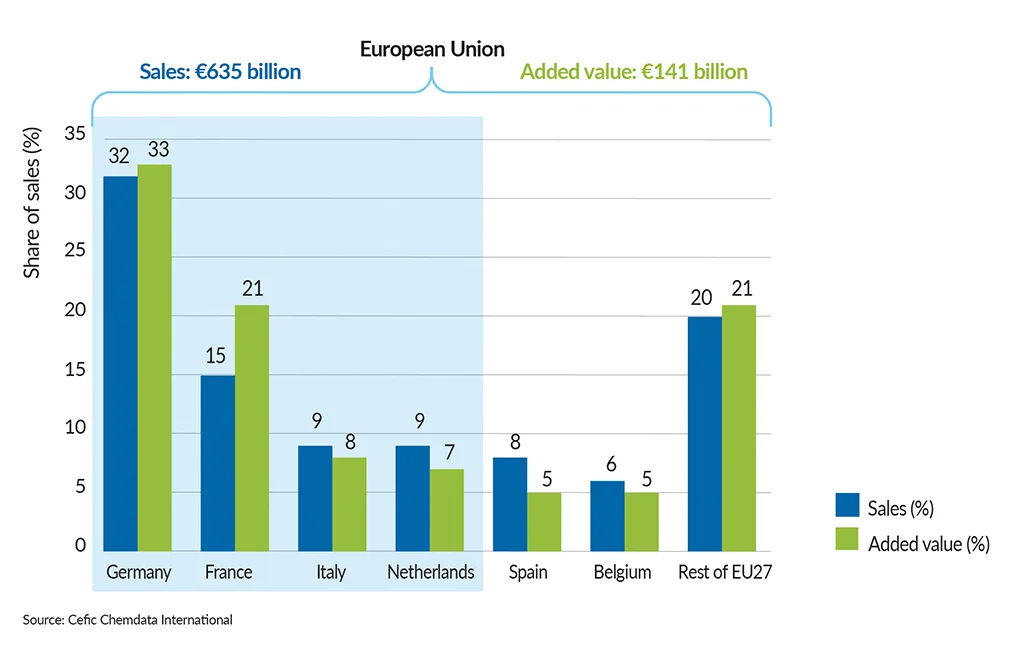
Four Member States drive two-thirds of EU27 chemical sales
EU27 top countries by chemical sales in 2024
EU27 chemical sales slightly decreased in 2024 vs 2023
EU27 chemical sales structure (€ billion)
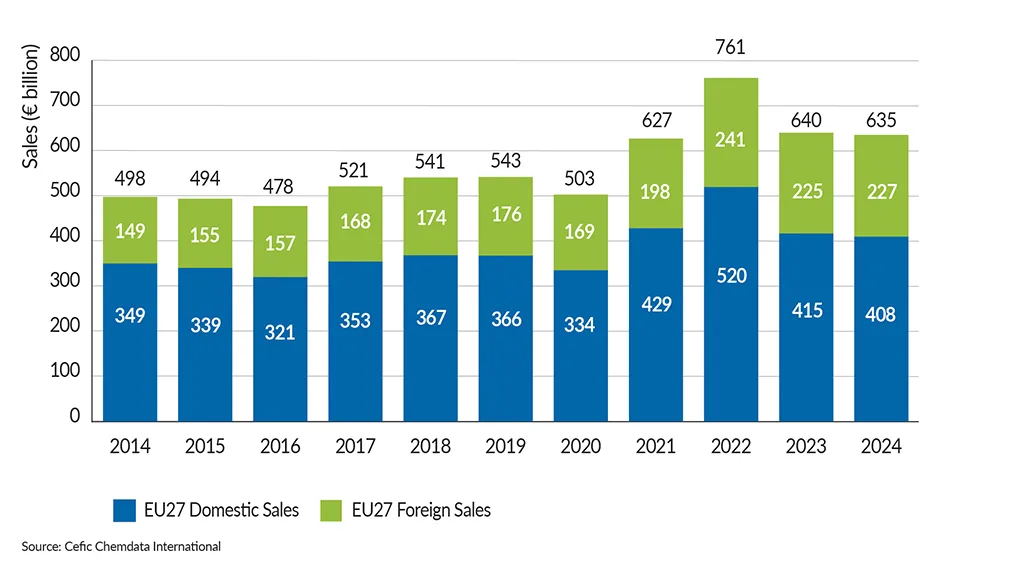
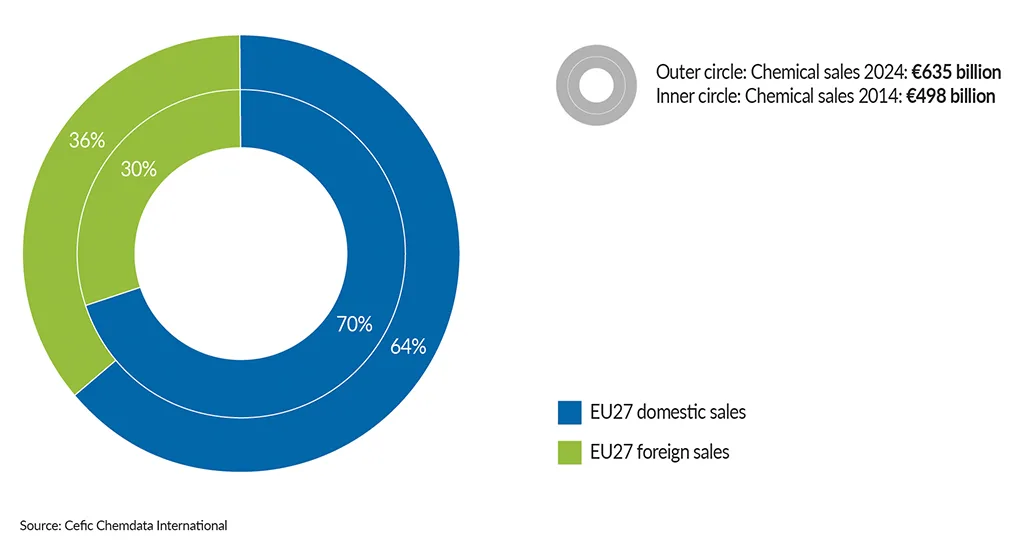
After one decade, foreign sales account for one third of EU27 chemical sales
EU27 chemical sales structure (€bn, %)
China overtakes Europe and the US as global leader in chemical sales
Evolution of chemicals sales (2004 vs 2024)
EU27 shares of chemical sales dropped sharply in a growing global market
EU27 share of global chemical market
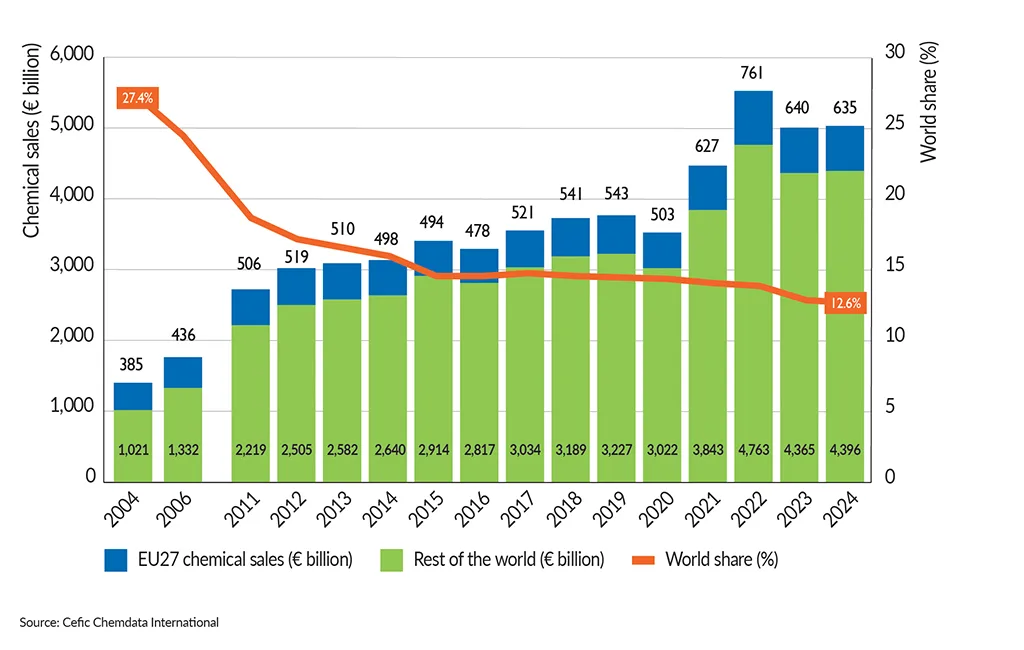
Global chemical sales 2024 are 3.6 times higher than in 2004
World chemical sales (2004, 1,406 billion)