Environmental Performance
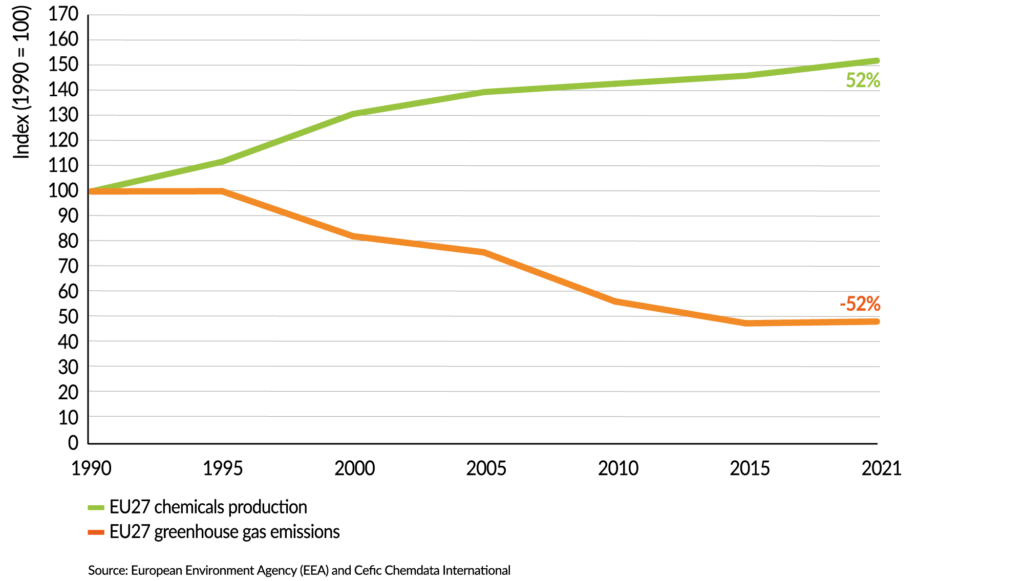
The total GHG emissions in the EU27 have witnessed a substantial decrease of 133 million tonnes (CO2) from 1990 to 2021, effectively halving the emissions. Remarkably, these efforts to lower emissions have had no adverse impact on the production growth of the chemical industry, which expanded by 52% in the EU27.
Cefic is fully supportive of the European ambition to lead in achieving climate neutrality by 2050 and remains committed to ongoing efforts in developing cleaner technologies, with a primary focus on increasing energy efficiency. Achieving this objective necessitates investments in breakthrough technologies. Beyond enhancing the energy efficiency of its internal processes, innovations in the chemical industry contribute to improving the energy efficiency of downstream users and their products.
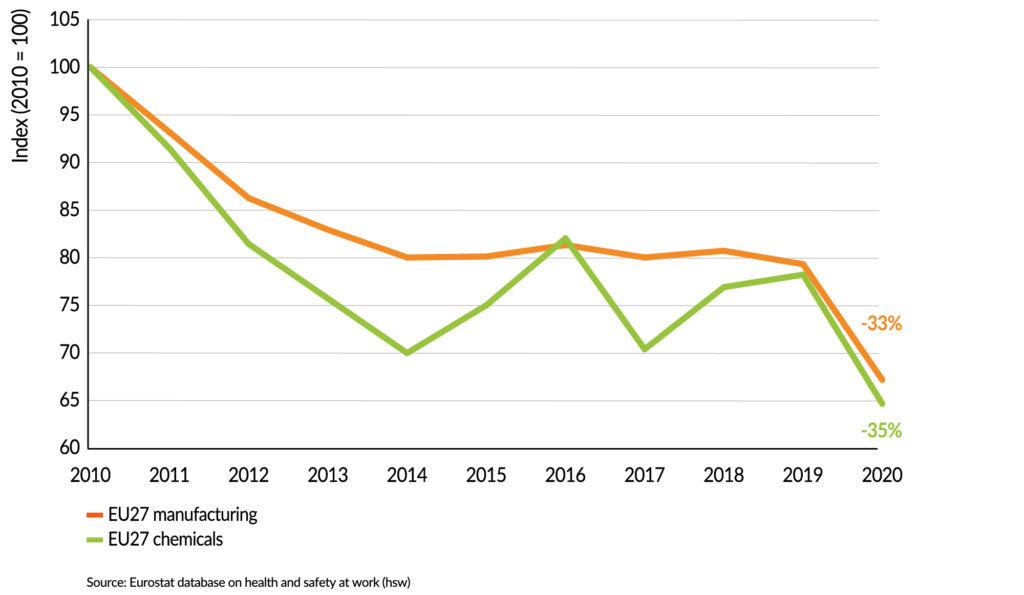
The chemical industry’s Responsible Care programme is centered on ensuring health and safety performance, with the primary goal of zero fatal accidents in the sector. Over the decade from 2010 to 2020, the total number of accidents in the EU27 chemical industry, both fatal and non-fatal, decreased by over one third. Notably, the statistics reveal that the number of fatal accidents at work in the EU27 chemical sector experienced a 5.4% annual decline between 2010 and 2020. The chemical industry is steadfast in its commitment to making continuous efforts to reduce the number of accidents to zero.
EU27 scope 1 GHG emissions fall 52% since 1990
Total scope 1 GHG emissions by the EU27 chemical industry
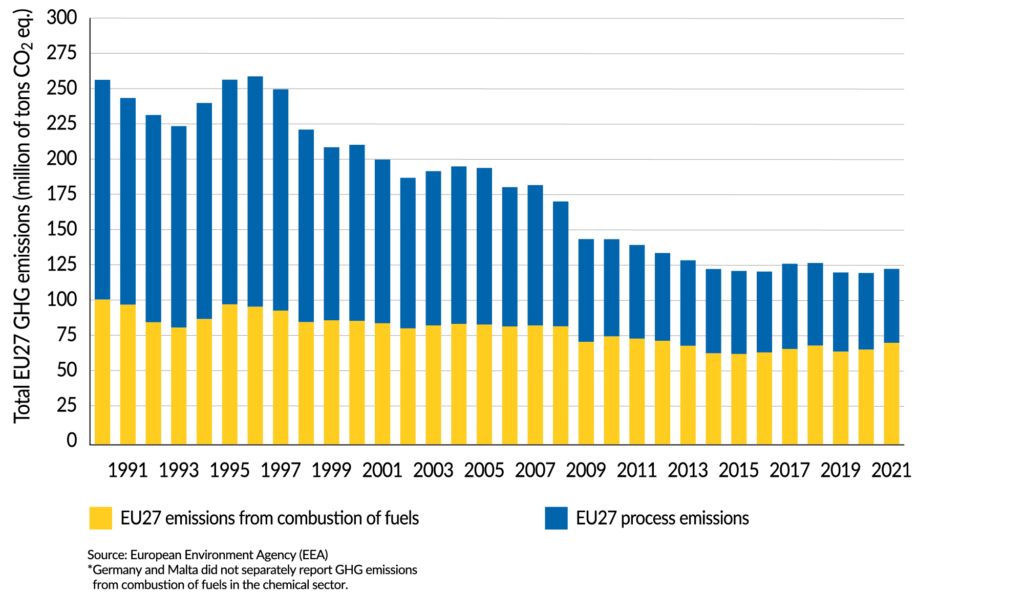
EU27 scope 1 GHG emissions fall by 133 million tonnes (CO2) since 1990
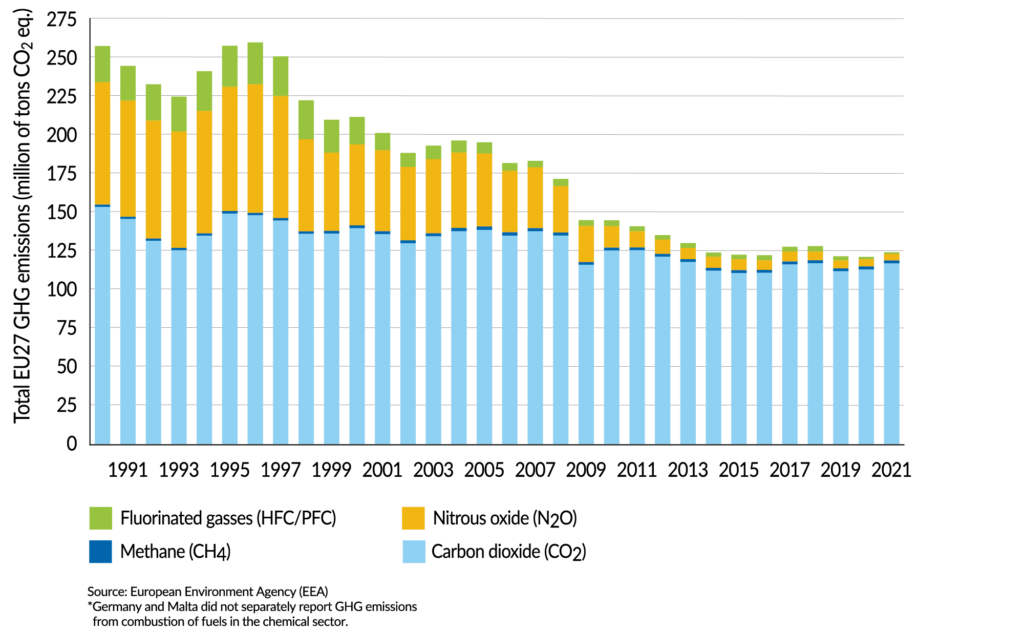
Total scope 1 GHG emissions per type of GHG by the EU27 chemical industry
EU27 chemical production and greenhouse gas emissions decouple
Total GHG emissions and production in the EU27 chemical industry
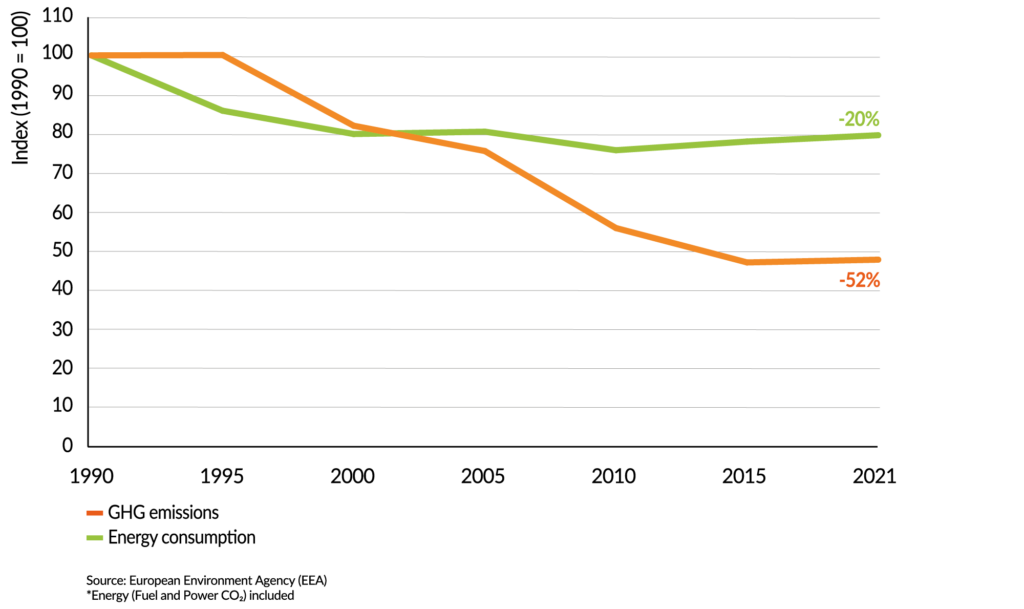
EU27 GHG intensity plummets significantly since 1990
Total EU27 GHG emissions and energy consumption in the EU27 chemical industry
Total number of accidents dropped by over one third in the EU27 chemical industry
EU27 number of accidents at work: chemicals vs manufacturing
Navigate the other chapters
Profile – Trade Development – Growth And Competitiveness – Our Contribution To EU27 Industry – Energy Consumption – Capital & R&I Spending
