


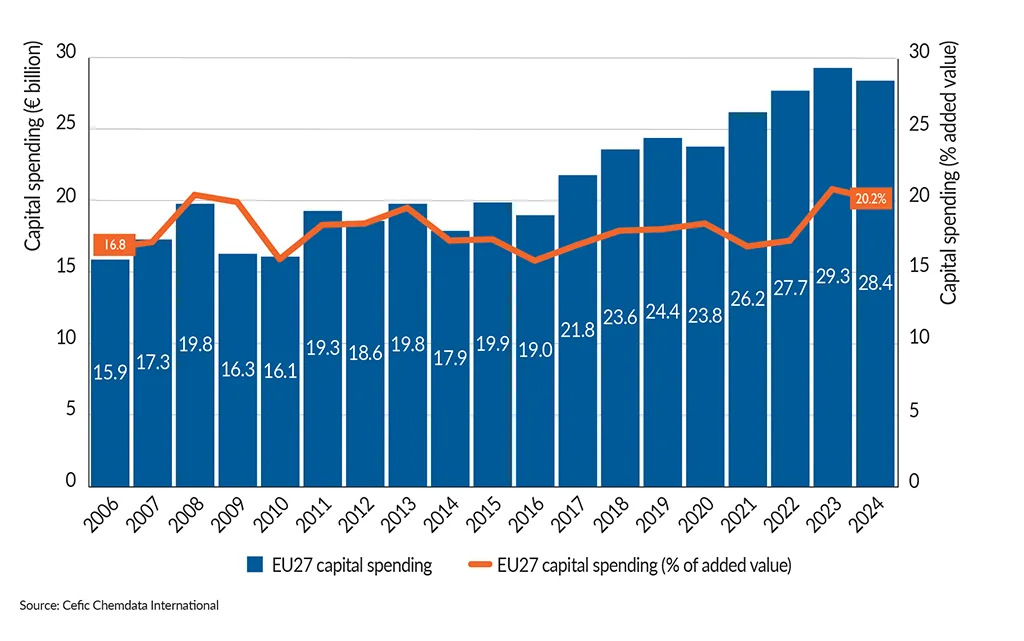
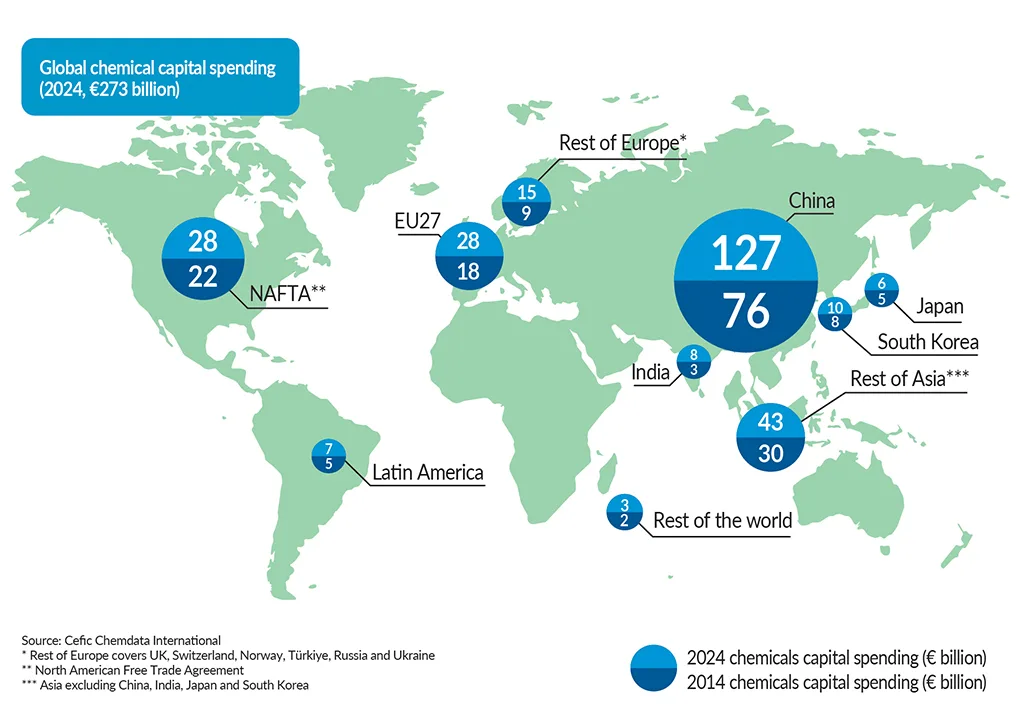
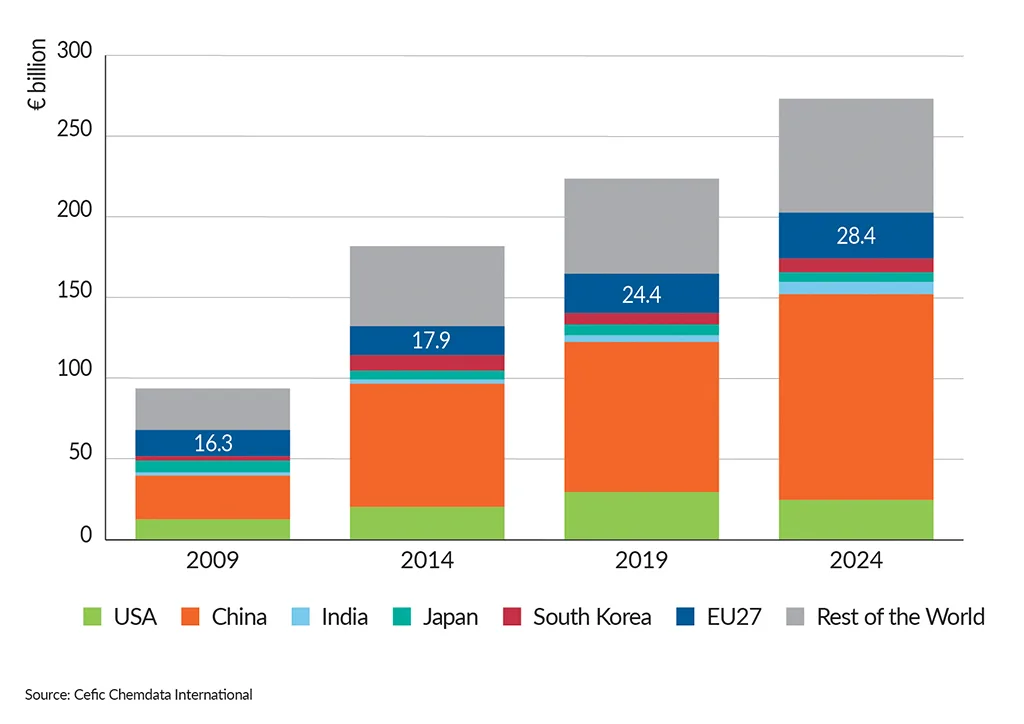
In 2024, capital spending in EU27 was 35% above the pre-crisis levels (2014-2019). Chemical companies globally have substantially increased their capital investment by almost 58% over the past decade (2014-2024), with China alone contributing to about 47% to the overall global investment. In 2024, the EU27 chemical industry reported capital spending of €28.4 bn, down from €29.3 bn in 2023. Europe accounts for 10% of the world’s chemicals investment. Capital investment plays a pivotal role in ensuring the future development and sustainability of the chemical industry. It is imperative for the European chemical sector to invest in both its existing infrastructure and new production facilities to guarantee a viable and dynamic future.
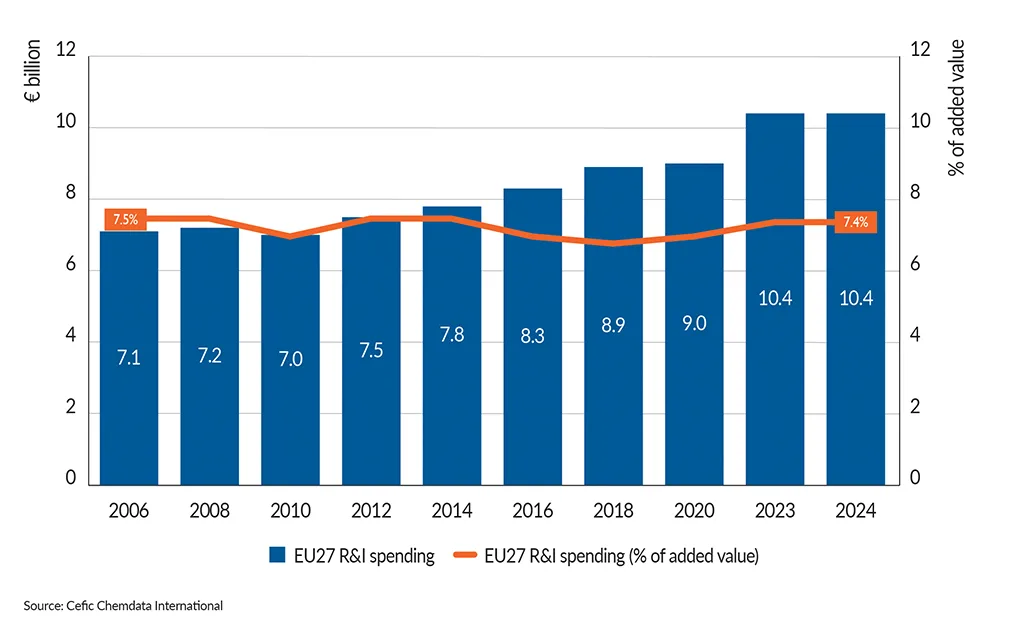
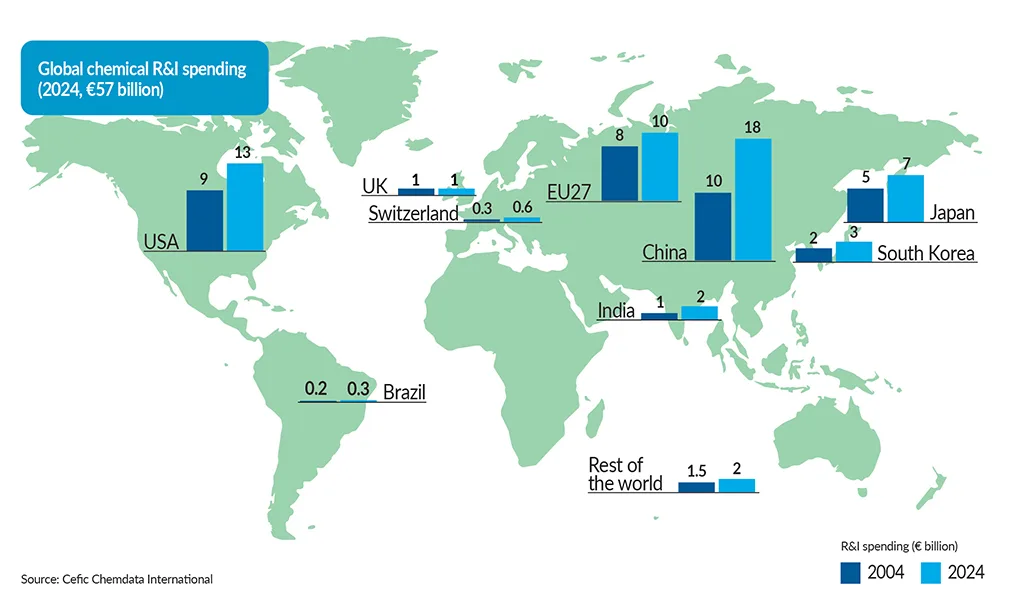
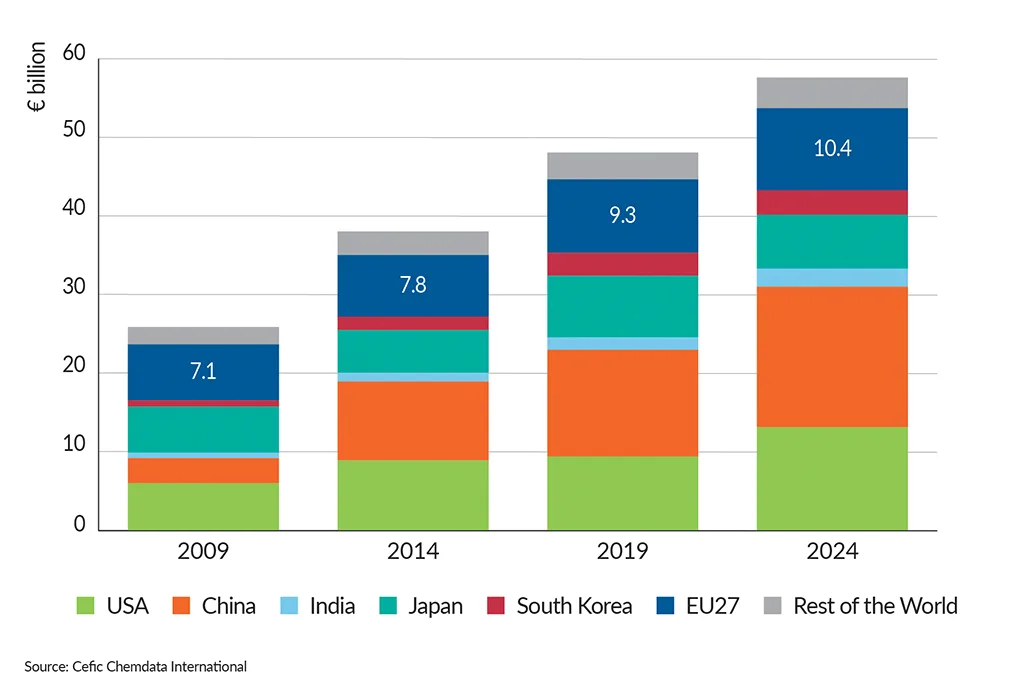
In 2024, R&I spending was 22% above the pre-crisis levels (2014-2019). A critical investment for maintaining competitiveness and addressing societal challenges lies in R&I. In 2024, R&I spending in the EU27 chemical industry remained as the same level as in 2023 (€10.4 bn). However, China continues to lead the global R&I spending, contributing to nearly one third of the overall global R&I spending.
The European chemical industry is still committed to enhancing its overall sustainability performance and recognises the importance of both disruptive technologies and the continuous improvement of existing technologies.
EU27 capital spending decreased in 2024 vs 2023
Capital spending in the EU27 chemical industry
China leads global chemicals investment
Capital spending by region (2014 vs 2024)
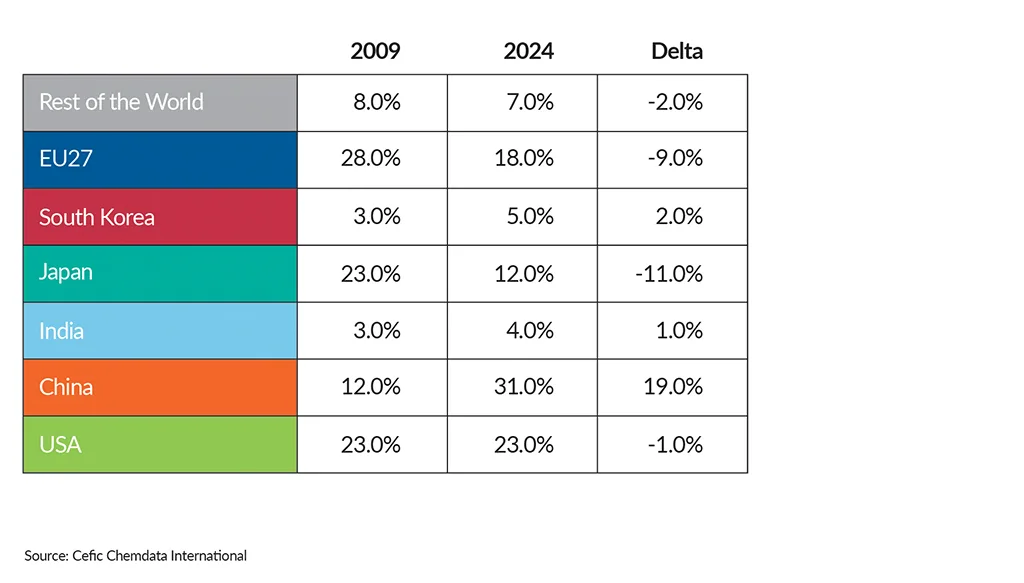
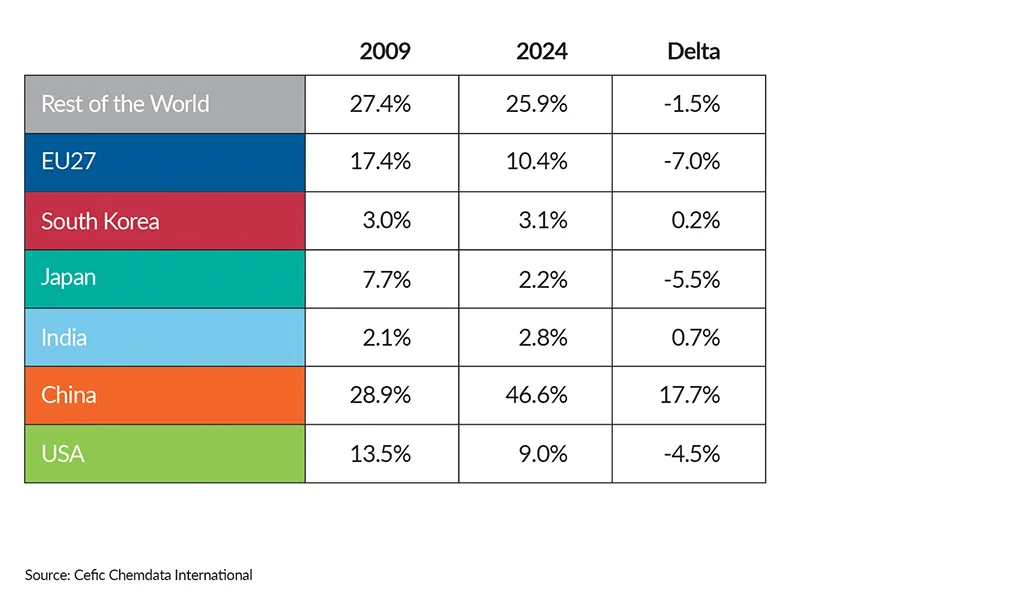
EU27 market share of capital spending dropped significantly
Evolution of chemical capital spending (2009-2024, € billion)
Global market share of capital spending
EU27 R&I spending reaches the highest level in 2023 and 2024
R&I spending in the EU27 chemical industry
EU27 ranks as the world’s third largest R&I investor in 2024
R&I spending in the chemical industry by region (2014 vs 2024)
EU27 market share of R&I spending has lost ground since 2009
Evolution of R&I spending in chemicals by region
Global market share of R&I spending