



Chemical industry snapshot
Updated with 2025 data
A heavyweight industry
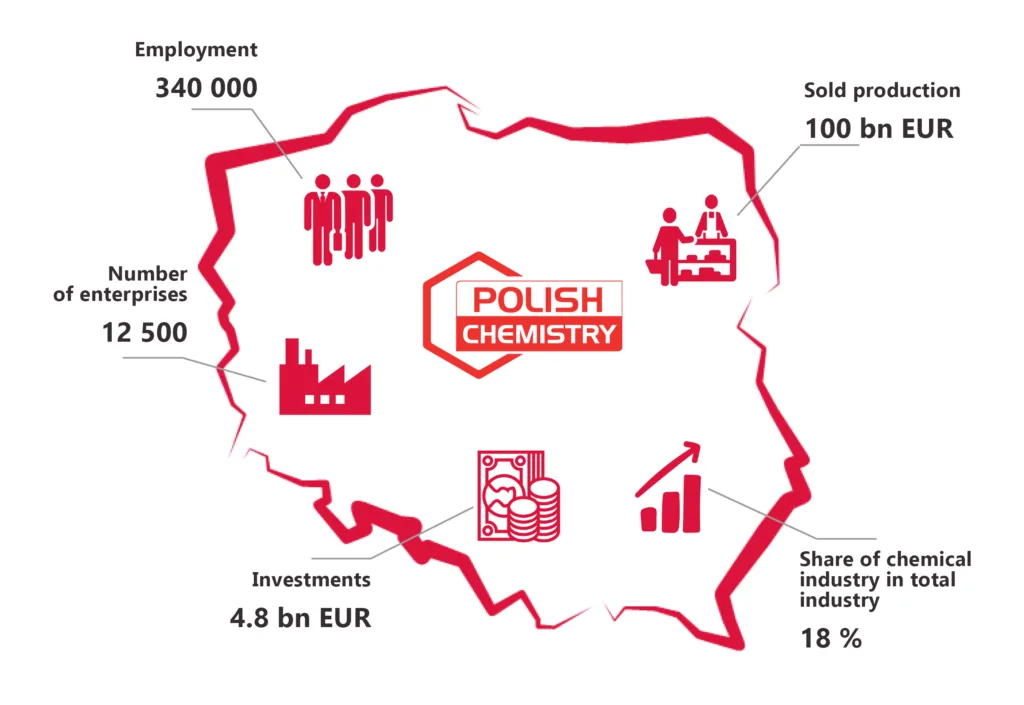
The Polish chemical industry is one of the pillars of Poland’s industrial base. In 2024, it generated approximately EUR 100.0 billion in sold production, accounting for 18% of total industrial production sold in Poland. Over the last decade, the sector has remained one of the fastest-growing areas of the Polish economy, with production sold increasing at an average annual rate of 7.05% between 2014 and 2024.
Production is geographically dispersed across the country. Manufacturing plants of the largest domestic producers are located in many regions, while processing facilities are often situated close to producers of chemicals in primary forms, helping to reduce transport costs and strengthen competitiveness.
A major industrial employer
In 2024, the chemical industry was the third-largest industrial employer in Poland, providing around 340,000 jobs and representing 13% of total employment in Polish industry. This means that the sector employs more people than automotive manufacturing, furniture manufacturing or mining. The largest share of employment within the chemical sector is generated by companies manufacturing rubber and plastic products.
Strong exports, structural import dependence
Foreign trade plays an important role in the Polish chemical industry. Poland has a strong position in processed chemical products, especially plastic articles, which recorded a trade surplus of approximately EUR 4.3 billion in 2024. At the same time, the sector continues to face structural import dependence in selected product groups, particularly pharmaceuticals and some raw materials and intermediates.
Overall, Poland recorded a long-standing trade deficit in chemicals, amounting to EUR 11.3 billion in 2024. This reflects both the scale of domestic demand and the role of imported raw materials and semi-finished products in Polish industrial value chains.
Key trading partners of Polish Chemistry, 2024
| Top export destinations | Export value | Top import origins | Import value |
| Germany | EUR 12.3 bn | Germany | EUR 15.4 bn |
| Czech Republic | EUR 3.3 bn | Belgium | EUR 4.8 bn |
| France | EUR 2.7 bn | Netherlands | EUR 4.7 bn |
| United Kingdom | EUR 2.1 bn | France | EUR 4.1 bn |
| Italy | EUR 2.0 bn | China | EUR 3.8 bn |
Polish chemical trade is strongly anchored in European value chains. Germany remains Poland’s largest chemical trading partner, both in exports and imports. Other key export destinations include Czechia, France, the United Kingdom and Italy, while the main import origins include Belgium, the Netherlands, France and China. This trade pattern reflects Poland’s role as both a supplier of processed chemical products and an importer of selected raw materials, intermediates and high-value products.
How are we doing?
The Polish chemical industry is shaped by the same structural trends as the wider European chemical sector: energy and climate transformation, regulatory pressure, circular economy, ESG, digitalisation, innovation, geopolitical uncertainty and the need to strengthen supply chain resilience.
Strengths
- Large and diversified industrial base with nearly 12,500 companies.
- Strong position in processed chemical products, especially plastic and rubber articles.
- Significant role in supplying key value chains, including construction, agriculture, packaging, healthcare, automotive and energy.
- Skilled workforce and strong engineering capabilities.
- Distributed production footprint across the country.
- Experience in safety, environmental management and Responsible Care.
Challenges
- High and volatile energy costs.
- Dependence on imported raw materials and selected intermediates.
- Structural trade deficit in some product groups, especially pharmaceuticals and mass chemicals.
- Investment pressure linked to decarbonisation and environmental regulation.
- Skills gap related to green transition, engineering and digitalisation.
- Rail infrastructure limitations and high transport costs.
Our contribution to a competitive Europe
Investment capacity under transformation pressure
In 2024, capital expenditure in the Polish chemical industry amounted to EUR 4.8 billion, representing around 20.8% of total industrial capital expenditure in Poland. Although investment has increased significantly over the last decade, 2024 brought a decline compared with 2023, reflecting the pressure of energy costs, regulatory uncertainty and the scale of transformation needs.
Sustainable development
Polish chemical companies are increasingly involved in activities supporting environmental protection, employee safety, local communities and the implementation of sustainable development goals. These actions include modernisation of installations, monitoring and reduction of environmental impact, safety improvements and voluntary initiatives for communities and the environment.
A key example is the Responsible Care Program in Poland. As part of its long-term educational and environmental activities, over 34.5 million PET bottles and 47 tonnes of abandoned waste have been collected, almost 44,000 trees have been planted and nearly 280,000 children, employees and volunteers have been involved.

