


The Paris Agreement requires tremendous efforts from all sectors to combat climate change. The transition to a low-carbon economy creates both opportunities and challenges. The European chemical industry wants to seize the opportunities arising from this transition. Further reduction of its greenhouse gas (GHG) emissions requires investments and continued innovation in technologies to further improve energy efficiency and further increase sustainable renewable energy and the use of alternative feedstock. (CHECK HYPERLINKS).
Contribution to the EU Green Deal
The purpose of the European Commission’s EU Green Deal is to develop cleaner energy and cutting-edge technological innovation to reduce GHG emissions and enhance the quality of life of European citizens. It prioritises boosting energy efficiency and eco-design of products. Reducing energy consumption, improving energy efficiency of production processes, and switching to low-carbon alternatives will contribute to this goal.
Cefic supports Europe’s ambition to become the first climate neutral continent by 2050. By reducing GHG emissions, the industry is working towards the EU’s ambitions for climate neutrality, clean energy and zero pollution.
Reducing GHG emissions
To limit the increase of the global average temperature to well below 2°C, and preferably 1.5°C, above pre-industrial levels, in line with the Paris agreement, it is necessary to reduce the world’s absolute greenhouse gas emissions. The chemical industry actively monitors its Scope 1 and Scope 2 GHG emissions to track progress in GHG emissions reduction. Scope 3 GHG emissions at the sectoral level have not been fully assessed due to the industry’s diverse product portfolios and complex value chains.
Scope 1 GHG Emissions
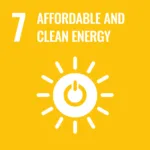
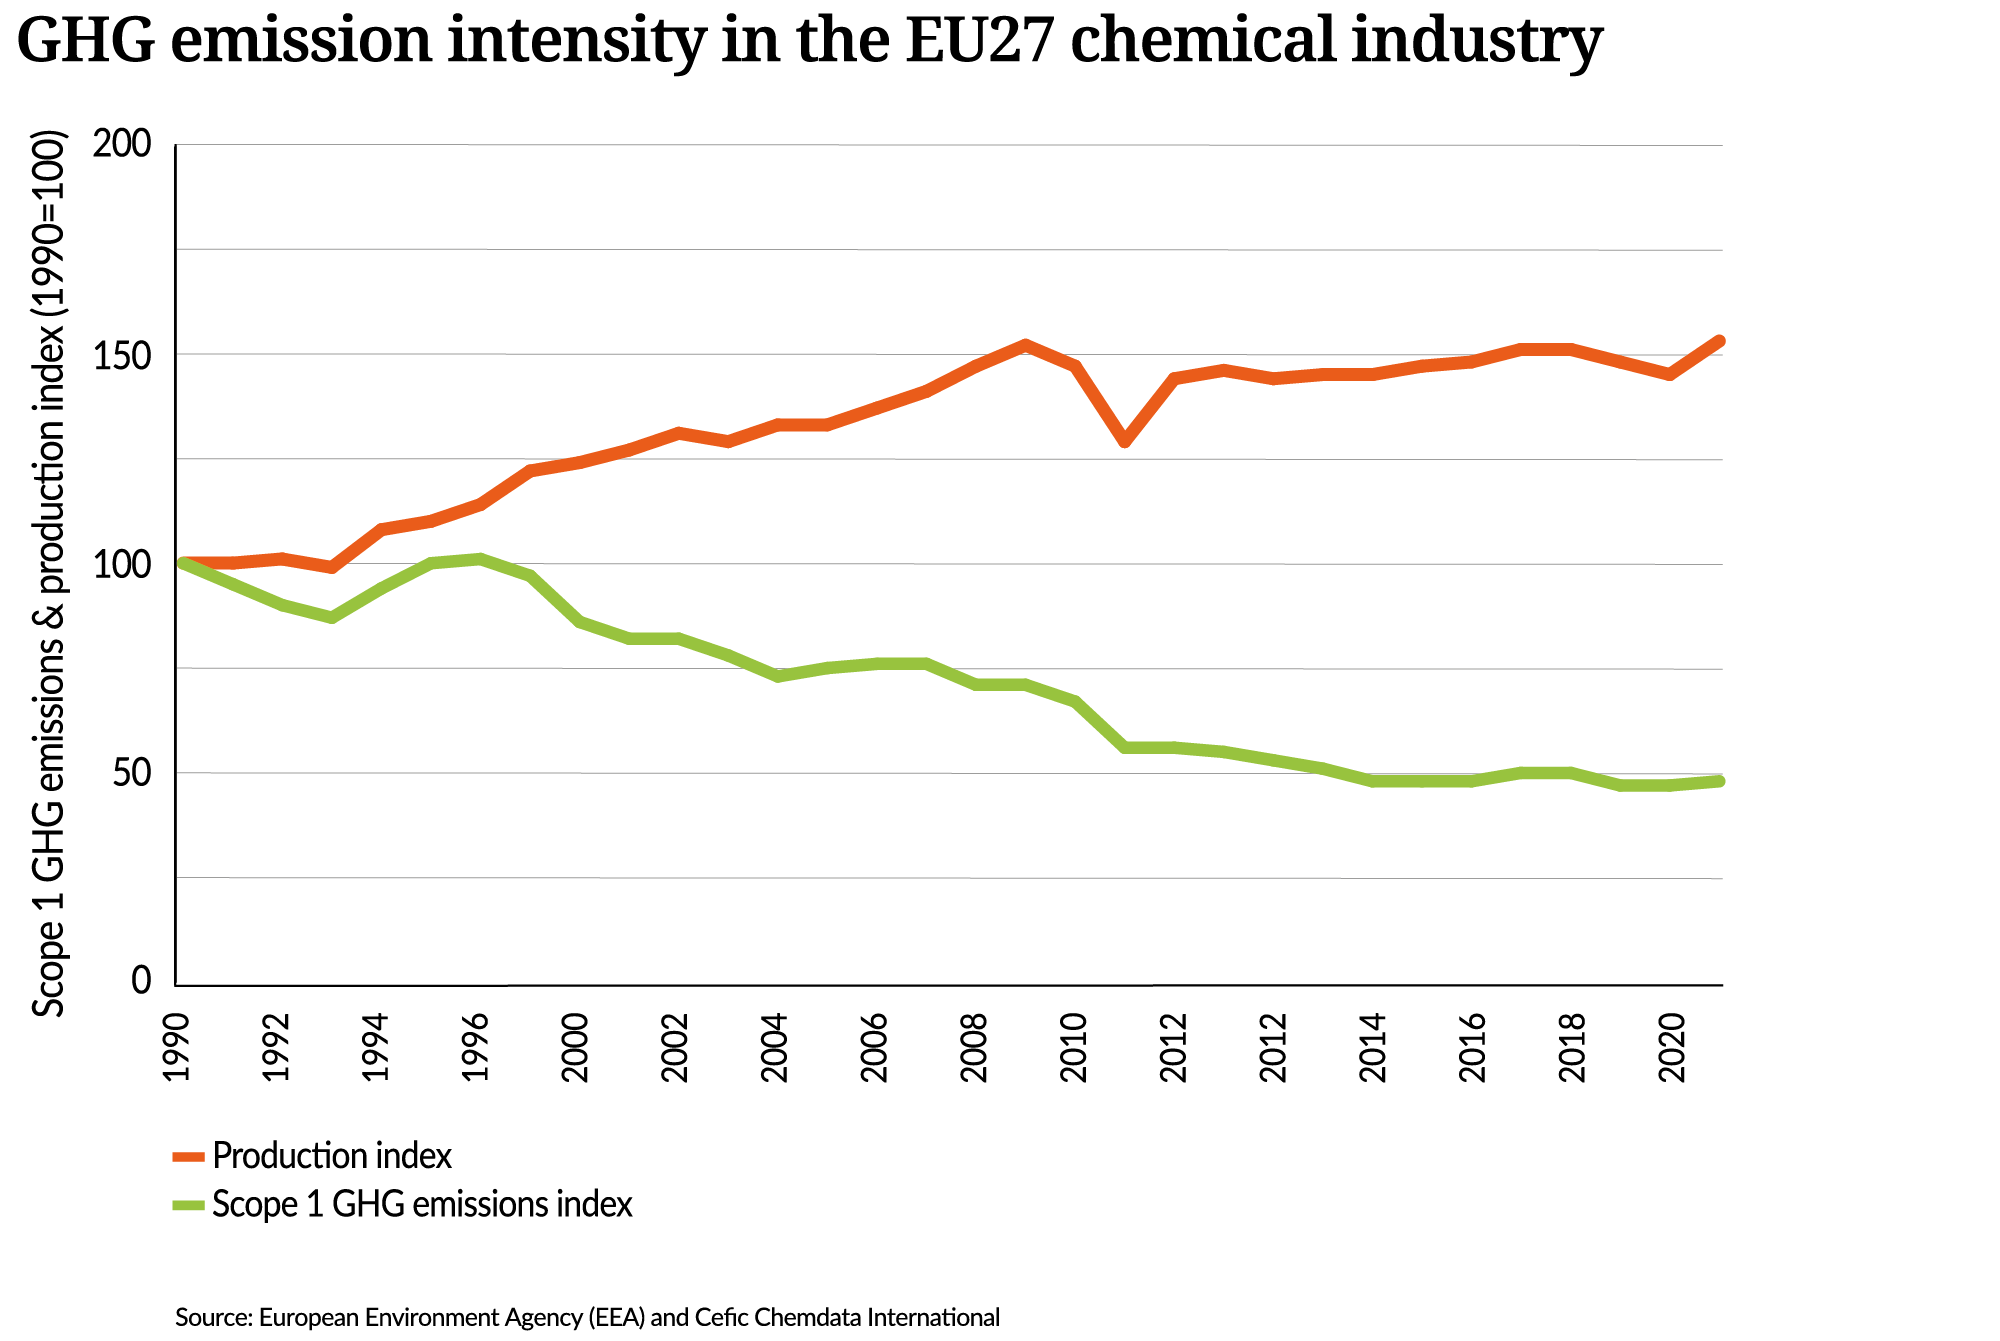
Scope 1 GHG emissions show an overall decreasing trend, even though the production index continues to increase, reaching a 53% increase in the period 1990-2021. Technological advancements in key production processes led to a notable 48% reduction in emissions between 1997 and 2013.
This reduction was heavily driven by the reduction of process emissions (-61%), mainly due to a significant decrease of nitrous oxide (N2O) and fluorinated gases emissions. The decline of nitrous oxide (N2O) emissions, which has a higher global warming potential than carbon dioxide (CO2) and methane (CH2), was mainly due to technological changes in the production processes. Technological improvements in the production of nitric and adipic acid, for example, explain that almost 50% of the total reduction since 1990 occurred in a brief period of 3 years (2007-2010). For fluorinated gases, this reduction was a result of phase-out of production of fluorochemicals. By 2021, the two groups of GHG gases have reached a reduction of 95%.
Despite the significant decrease in GHG emissions from 1997 to 2013, process emissions reductions have slowed down, while combustion emissions have remained stable over the past decade. The chemical industry is looking into the development of emerging technologies to continue on a reduction path.
Total scope 1 GHG emissions by the EU chemical industry
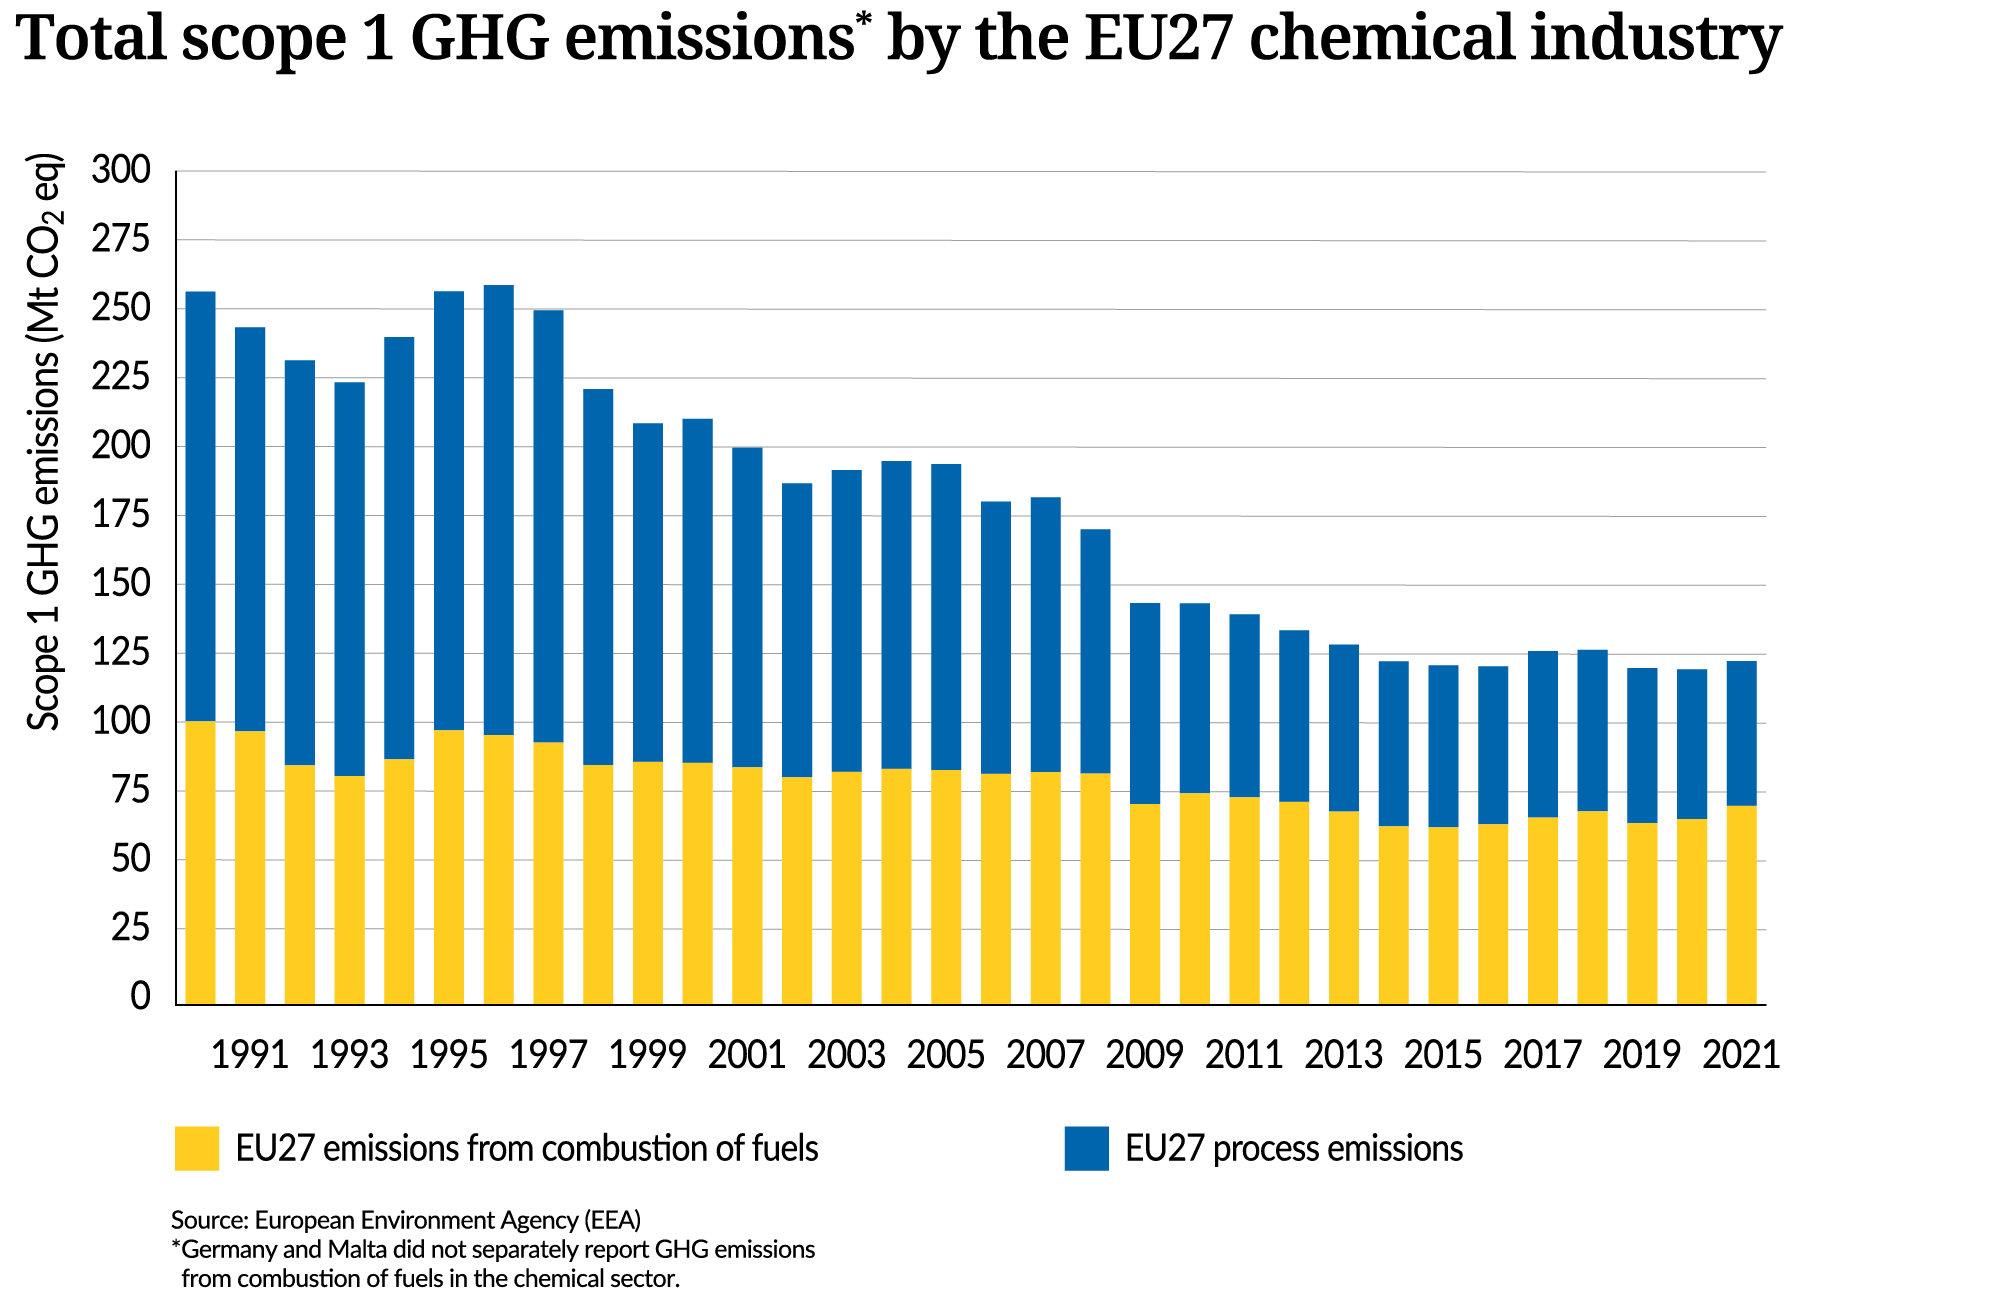
Total scope 1 emission per type of GHG by the EU27 chemical industry
GHG emission intensity in the EU27 chemical industry
Scope 2 GHG Emissions
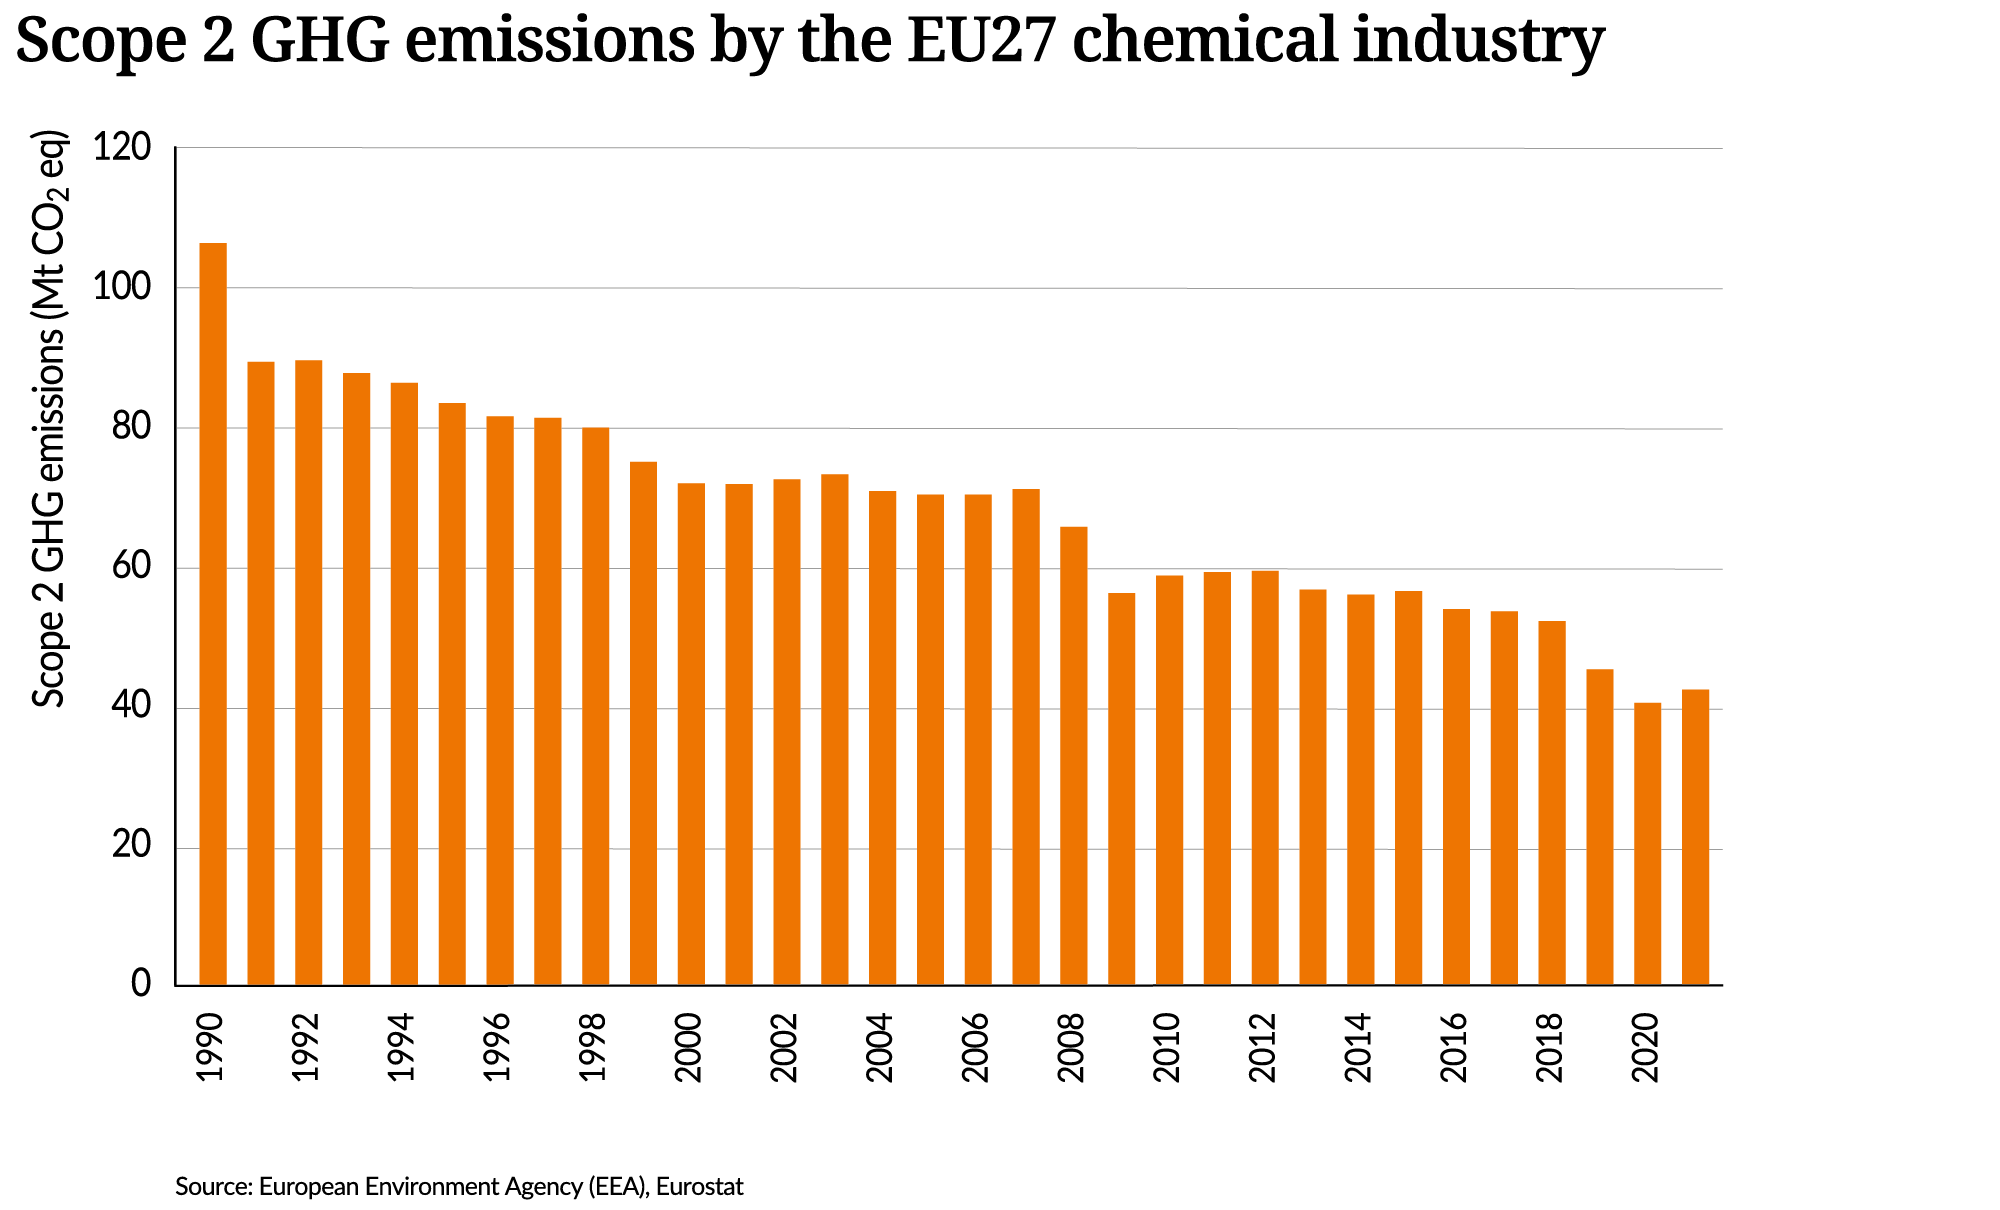
Scope 2 emissions, estimated based on electricity consumption and location-based emission factors, decreased by 60% from 1990 to2021. This was driven by a 14% drop in electricity consumption by the sector, and a transition to low-carbon emissions and renewable electricity sources in the EU member states.
Chemical companies can reduce scope 2 GHG emissions by striving for power contracts with a higher share of low-carbon electricity. Many have already signed Power Purchase Agreements to increase their consumption of low-carbon electricity. However, this may not always be accurately reflected in the calculations of sector scope 2 GHG emissions, as they rely on the average GHG emission factors for the electricity mix of individual member states. Therefore, this method has limitations, as it is challenging to differentiate between the transition to low-carbon electricity by our sector and that of other sectors in the different member states.
Scope 2 GHG emissions by the EU27 chemical industry


Improve energy efficiency of production processes
Improving energy efficiency in the energy-intensive chemical sector is a determining economic success factor and an important instrument to further reduce GHG emissions and thus facilitate the transition to climate neutrality.
Total energy consumption
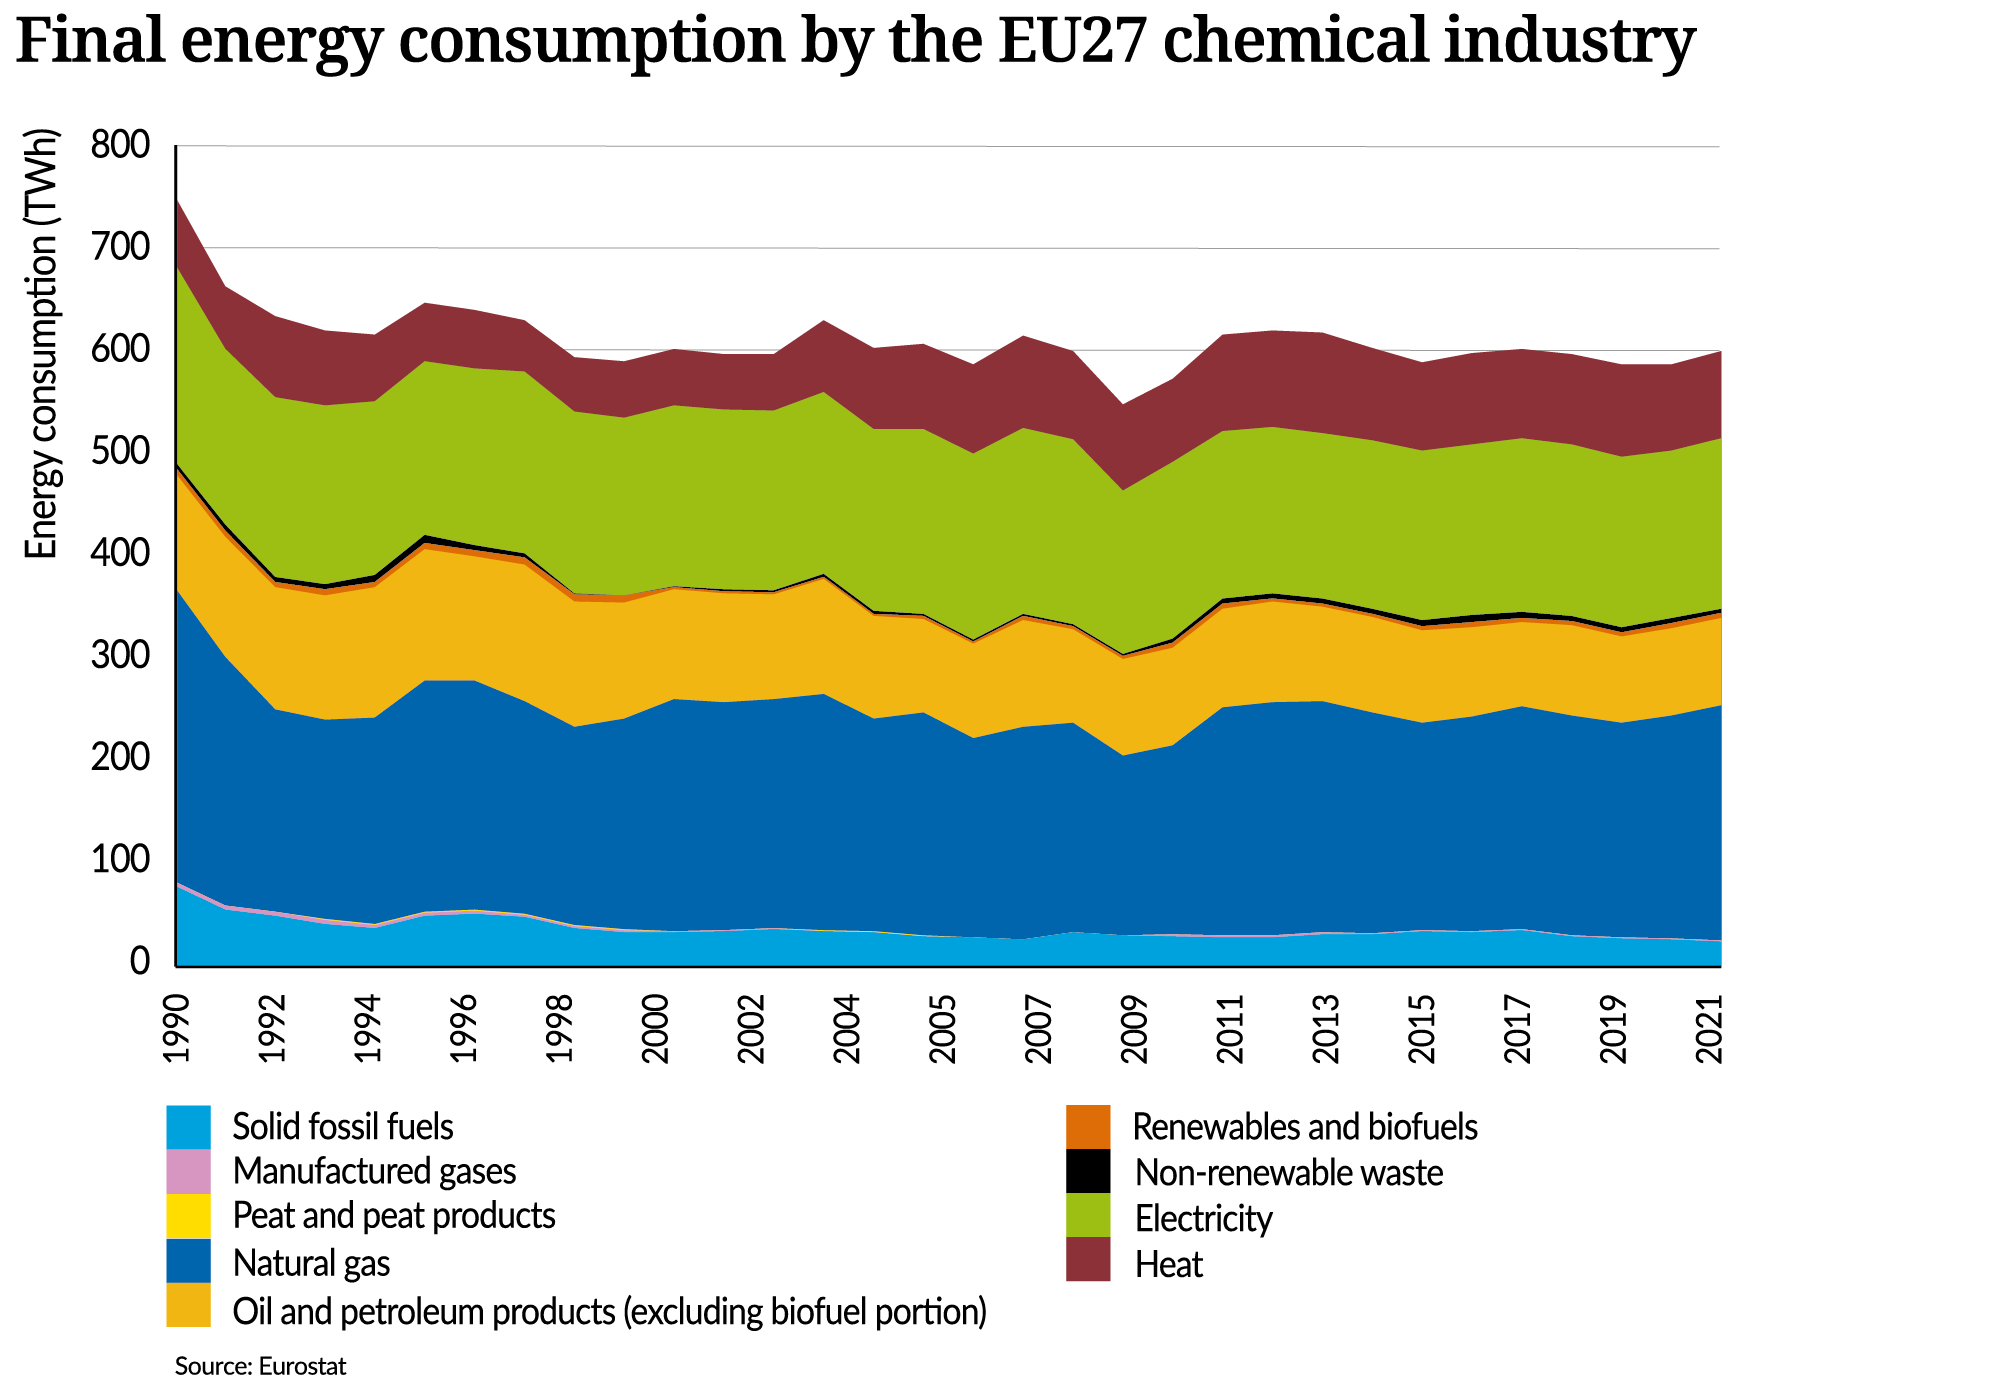
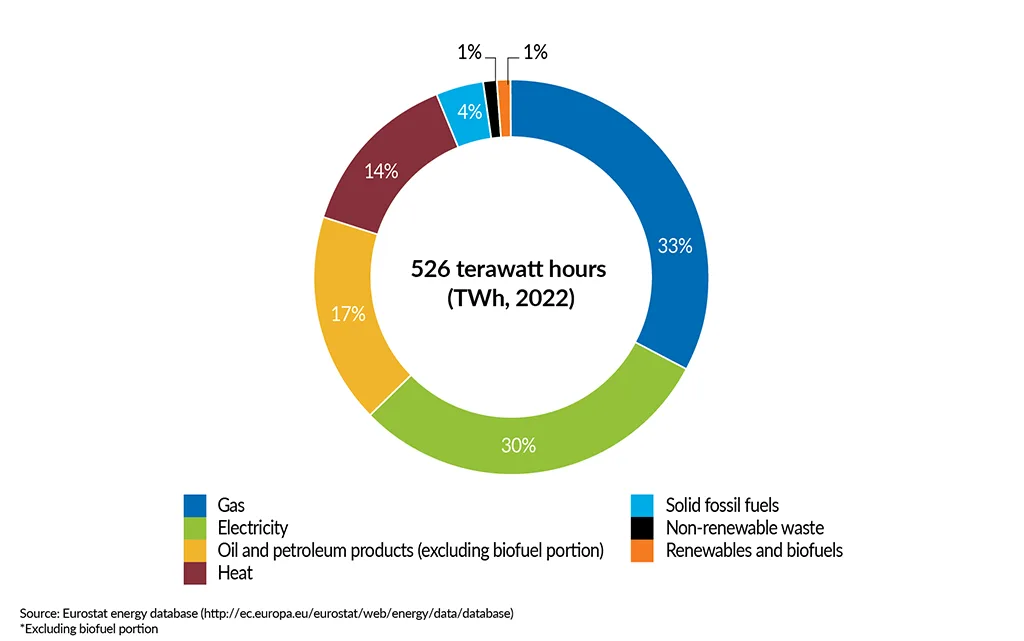
Significant advancements in energy efficiency and energy recovery in production processes have lowered the total energy consumption in the chemical and petrochemical industry, despite a sharp rise in the production index (53% by 2021). Natural gas and electricity are the primary energy sources, accounting for 38% and 28% respectively in 2021. Oil and petroleum products used as energy source *peaked in the late nineties but decreased slowly during the last two decades to around 15%. Energy consumption out of solid fossil fuels was relatively low in 1990 and decreased further by 69% over the period 1990-2021. As we move towards climate neutrality, electricity consumption is projected to rise. Ensuring ample availability of low-carbon electricity will be crucial.
*It is important to keep in mind that natural gas, oil and petroleum products are not only used as energy source, but also as feedstock, see Connect Circular Economy.
Final energy consumption by the EU27 chemical industry
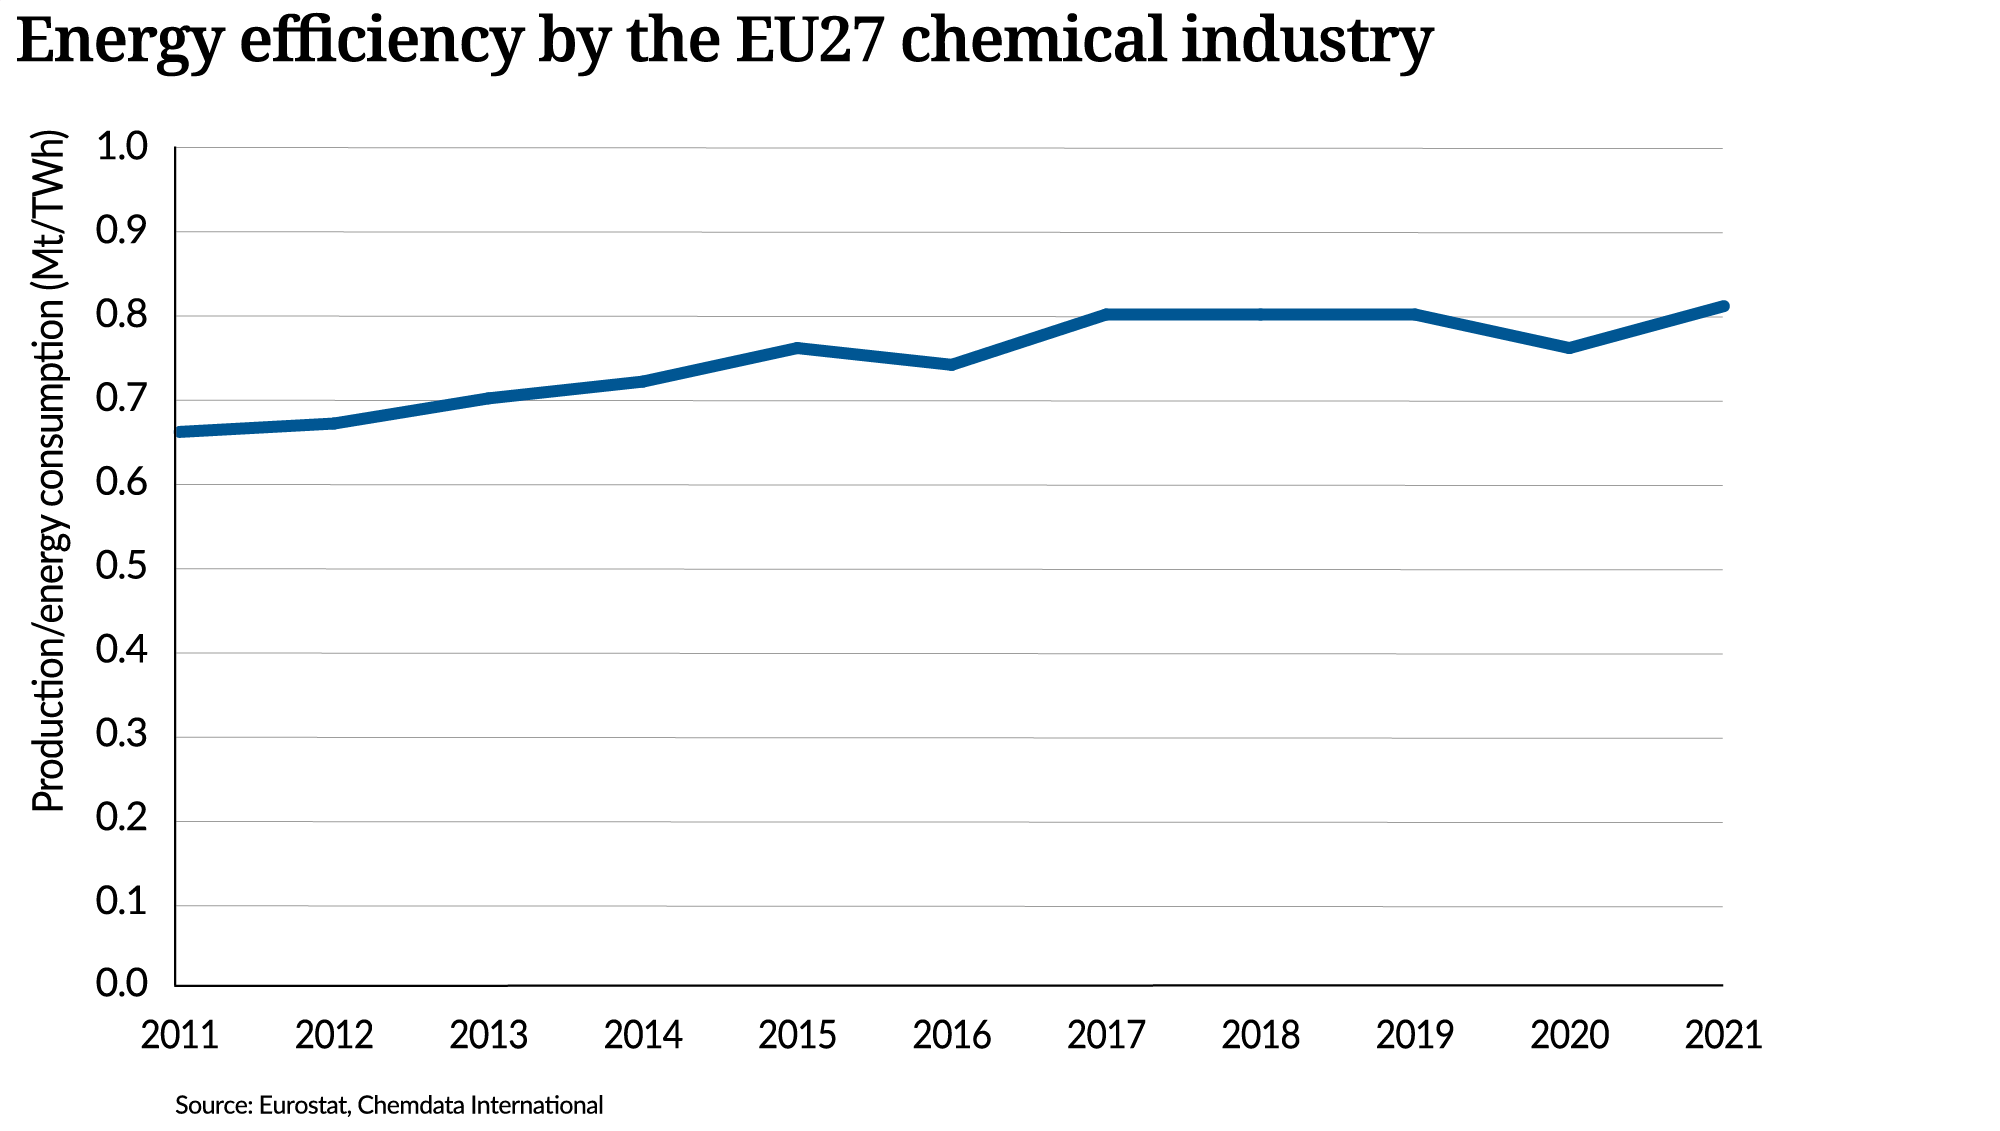
The energy efficiency of the European chemical industry improved over the period 2006-2021, with a 22% increase. Global economic crises in 2016 and 2020 had a negative impact on the energy efficiency of the production processes. During crises, decreased production can lead to sub-optimal operation of installations , affecting energy efficiencies. This is confirmed by lower production volumes in weight in 2019 and 2020.
Total energy consumption in the EU27 chemical industry by source, 2021 (%)
Energy efficiency by EU27 chemical industry