Connect Circular Economy
Estimated reading time: 5 minutes
The European chemical industry can become central to Europe’s circular economy, offering innovative solutions from design to end-of-life, benefiting the sector itself and its value chain. By transforming waste into valuable raw materials and using circular feedstock, the industry plays a crucial role as recycler for the circular society, contributing to achieve the Sustainable Development Goals, notably SDG 9 and SDG 12.
Contribution to the EU Green Deal
The European Commission’s Circular Economy Action Plan (CEAP), adopted in March 2020, outlines Europe’s agenda for sustainable growth. It introduces initiatives along the entire life cycle of products, targeting design, circular economy processes and sustainable consumption whilst ensuring that waste is prevented and resources used are kept in the EU economy as long as possible. The chemical industry contributes to the CEAP by focusing on recycling and reuse of resources through the use of alternative feedstock as well as by putting circularity as a criterium when designing chemicals and materials for a wide variety of applications.
Increase share of alternative feedstock
One of the key pathways to a successful transition towards a climate neutral circular economy is the use of alternative and more circular feedstocks, such as (plastic) waste, captured CO2, and biobased materials.
According to Eurostat, in 2021, the chemical and petrochemical industry consumed 57.2 Mt of oil and petroleum products as raw materials, of which 61% was naphtha. The same year, the industry consumed 655,147.0 TJ of natural gas for non-energy purposes, in addition to the consumption of 929,256.5 TJ for energy purposes.
The chemical industry aims to increase the use of alternative feedstock in its processes. In the European Commission’s Communication on Sustainable Carbon Cycles, an aspirational target on the share of sustainable non-fossil carbon in chemical and plastic products of 20% has been set. In parallel, it is important to assess the carbon and environmental footprint of these alternatives and their impact on performance and functionality of end products to compare it to those of current fossil-derived products. For instance, the use of alternative feedstock might come with decreased material & energy efficiencies that should be evaluated against the feedstocks which are deployed today.
Biobased feedstock
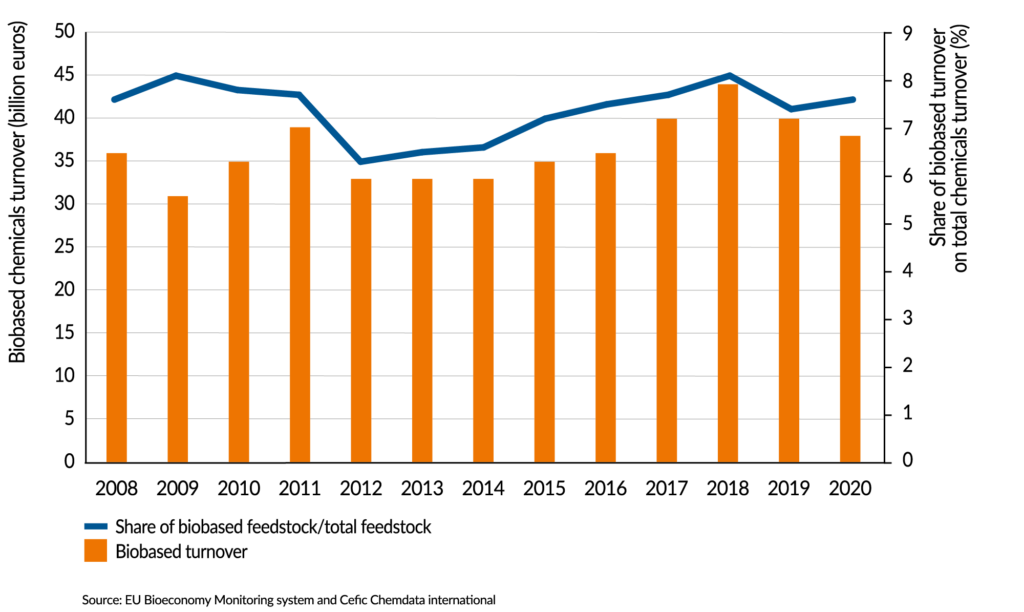
The turnover of biobased chemicals fluctuated between 30 and 45 billion over the period 2008-2020. The share of biobased chemicals turnover on total chemicals turnover varies between 6% to 8%.
Using biobased materials as feedstock requires consideration of competition with other land uses, which may need to be prioritised from a public policy perspective, such as food supply and ecosystem services like carbon storage and biodiversity. When deploying biomass as industrial feedstock, constant supply needs to be guaranteed, supply and production infrastructure need to be adjusted while the quality of biobased products needs to be constant and remain high.
Turnover of biobased chemicals production by the EU27 chemical industry
Value added as a proposition of GDP in the EU27 chemical industry
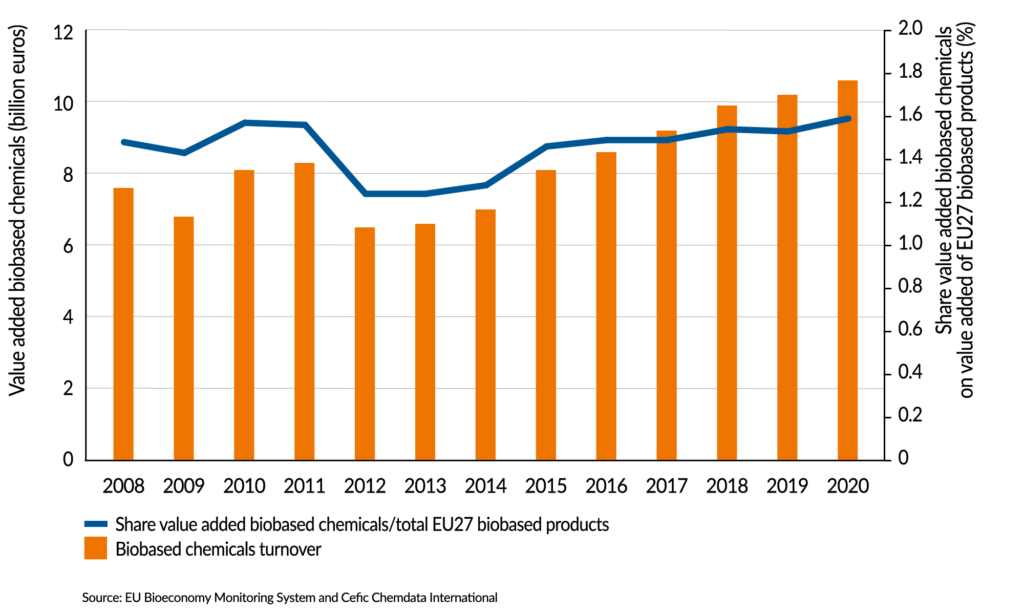
The value added of biobased chemicals, which is around 1.5% of the total biobased value-added, fluctuated before 2012. Since then, due to an increasing focus on high value added products (IEA, 2020), an increase of the added value is observed from 6.5 to 10.5 billion euro.
Waste based feedstock
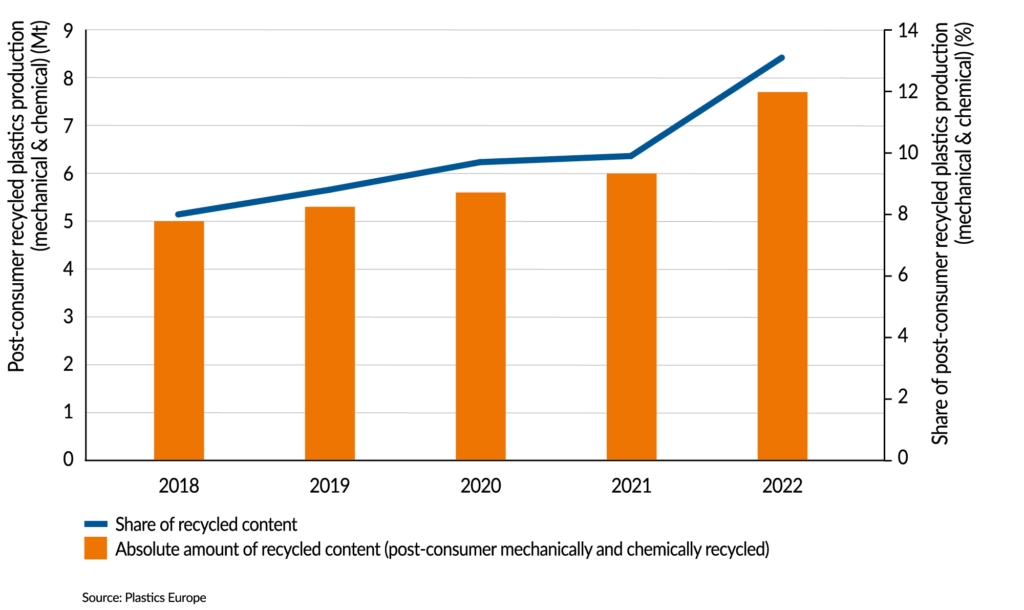
Recycling of waste is getting more importance as alternative feedstock source for the chemical sector. This is most advanced in the plastic cycle, where the absolute amount and share of recycled content in new products has reached 7.7 Mt and 13.1% of total feedstock, respectively. Recycling of plastic waste plays also a major role in keeping carbon in the loop, as described in Cefic’s Sustainable Carbon Cycles.
European recycled plastics production
Associated SDG targets
© Reserved copyrights UN SDGs