Chemical industry snapshot
Relative Importance of the Activity – Gross Value Added
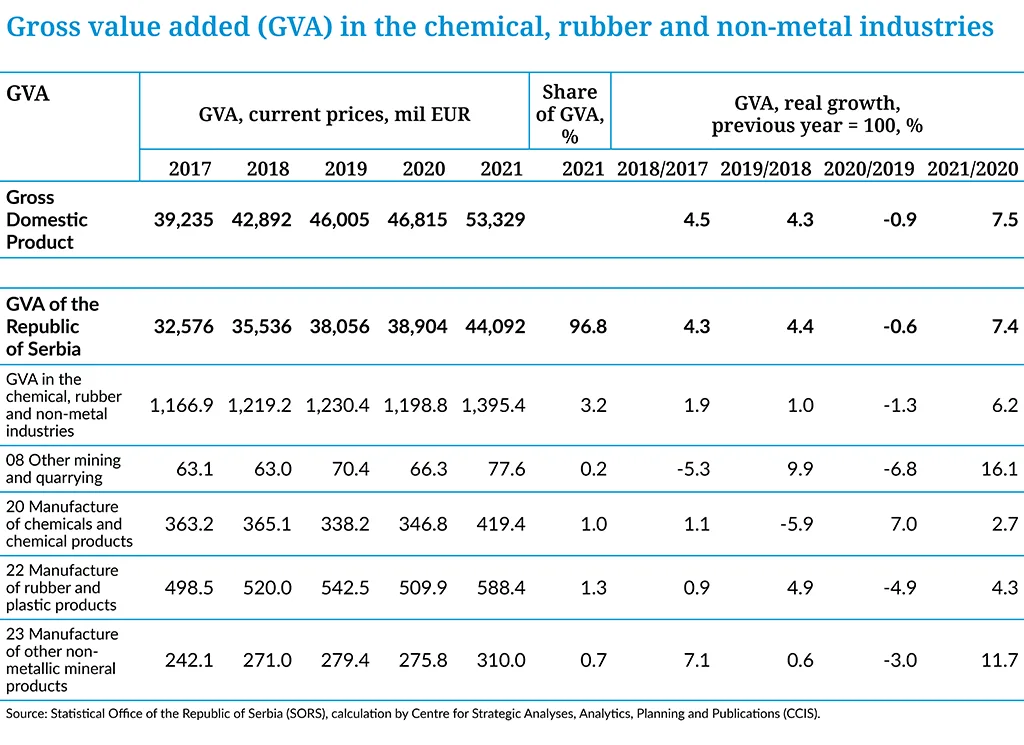
Amounted to EUR 1.4 billion, which accounts for 3.2% of the total realized GVA of the Republic of Serbia, with the year-on-year real growth rate of 6.2%.
In the structure of gross value added of the section of manufacturing, the largest share accounted for the manufacture of rubber and plastic products, 8.5% (EUR 588.4 million), and the manufacture of chemicals and chemical products, 6.0% (EUR 419.4 million). The realized GVA in the manufacture of non-metallic mineral products amounts to EUR 310.0 million (4.5% of GVA of the section of manufacturing), and in other mining and quarrying EUR 77.6 million (6.8% of GVA of the section of mining and quarrying).
The highest year-on-year gross value added growth was recorded in the manufacture of other non-metallic mineral products (11.7%), while the decline was not registered in any activity of the mentioned industry. In other mining and quarrying recorded an increase in gross value added (16.1%).
Note: in total = the share of activity sections and divisions of CA (2010) in the recorded GVA of the Republic of Serbia
by section = the share of activity division of CA (2010) in the GVA of the activity section of CA (2010) it belongs to
Companies and Entrepreneurs
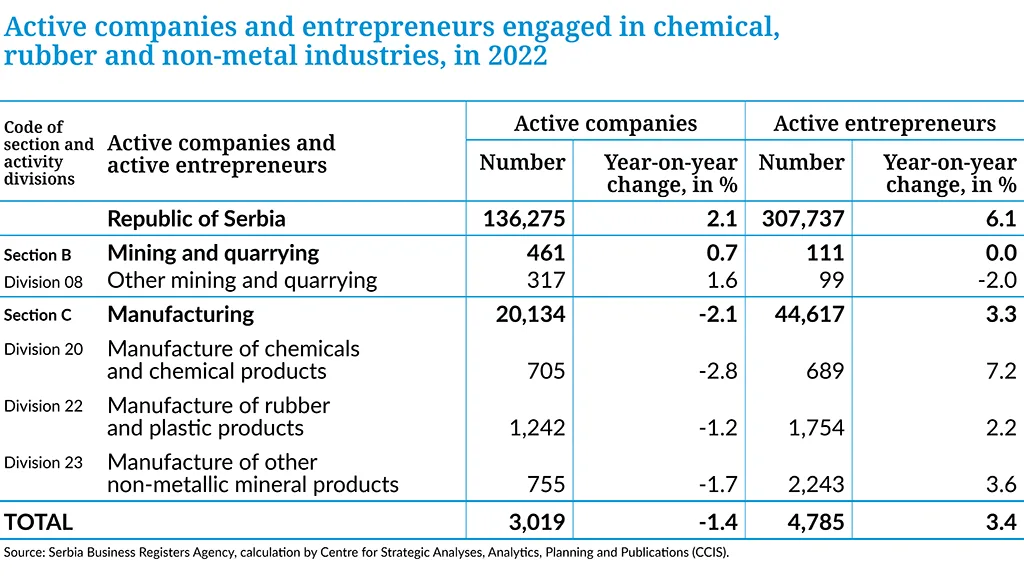
According to the calculations of the CCIS, and based on the data of the Business Registers Agency, in 2022, 3,019 companies operated in the chemical, rubber and non-metal industries, which accounts for 2.2% of the total registered companies in the Republic of Serbia. Out of that number, the majority of companies are registered for the manufacture of rubber and plastic products (41.1%). Somewhat lower number of companies operated in manufacture of non-metallic mineral products (25.0%) and the activity of manufacture of chemicals and chemical products (23.4%). The lowest number of active companies (10.5%) is in the activity of other mining and quarrying.
In addition to companies, in 2022, about 4,785 entrepreneurs were engaged in chemical, rubber and non-metal industries.
Turnover
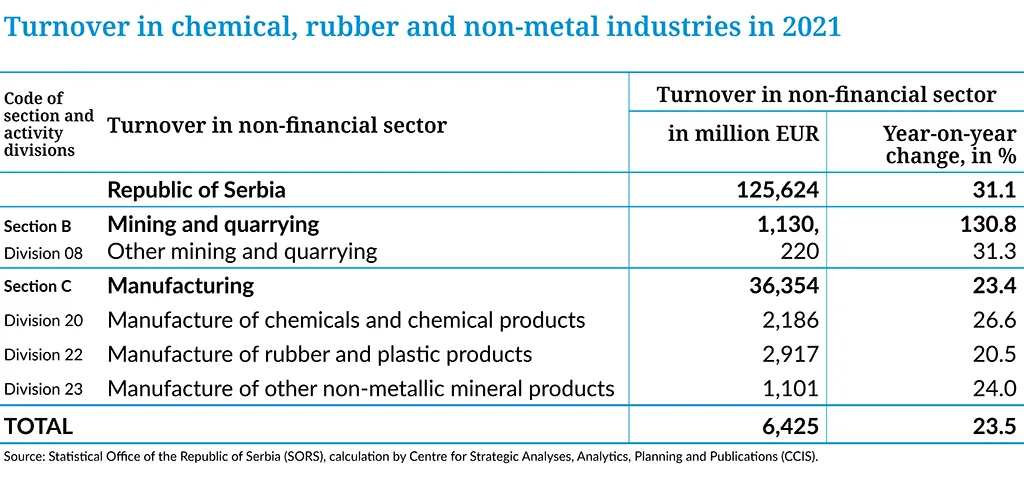
The total realized turnover, i.e. the total value of sold products and services in the non-financial business economy in the Republic of Serbia, in 2021, amounted to EUR 125.6 billion, which constitutes a year-on-year growth of 31.1%. In 2021, the chemical, rubber and non-metal industries recorded the total turnover of EUR 6.4 billion, which accounts for 5.1% of the realized turnover in the non-financial business economy in the observed year. Since 2017, the turnover in these industries has recorded the progressive year-on-year growth rates.
How are we doing?
Industrial Production
In 2022, in the section of manufacturing, industrial production grew by 1.4% as compared with 2021. If the period from 2018 is observed, it is noticed that this economic indicator has recorded a continued year-on-year growth. In 2022, the growth in industrial production of 22.6% was recorded in the section of mining and quarrying.
The highest increase in production was recorded in the other mining and quarrying, by 5.9%, whereas the manufacture of rubber and plastic products and the manufacture of chemicals and chemical products recorded a sharpest decline of 4.2% and 6.1%, respectively. In the five-year period, (2018–2022), all observed activities, recorded an average year-on-year growth in industrial production, in the range of 0.2% to 4.5%, except in the production of chemicals and chemical products, where a decline in industrial production was recorded in the amount of 1.3%.
Employment
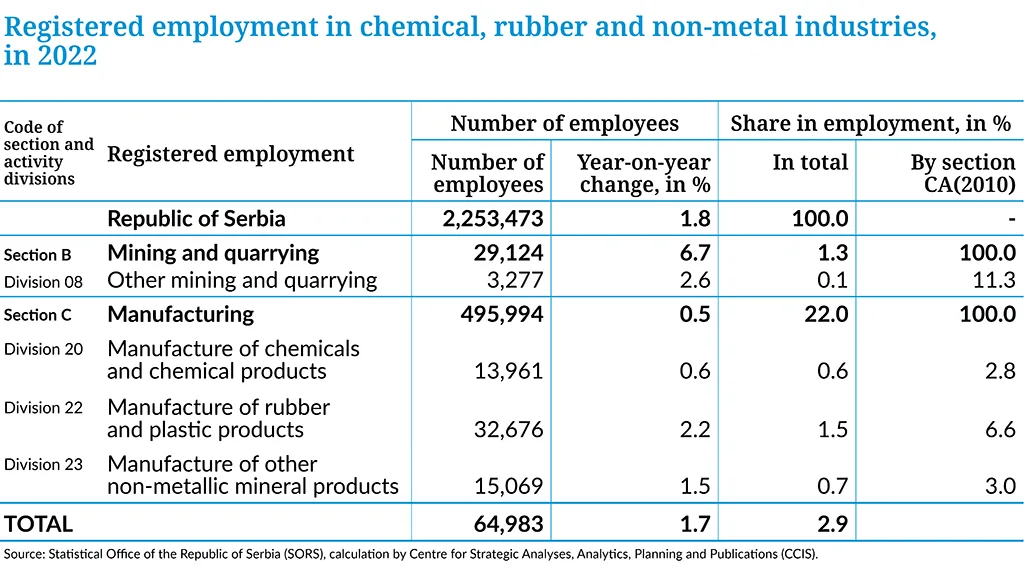
According to the data of the Statistical Office of the Republic of Serbia, in 2022, the total of 2.2 million employees were registered in the Republic of Serbia at legal entities and with entrepreneurs. In 2022, the number of employees at legal persons and with entrepreneurs in the chemical and rubber industry, manufacture of non-metallic mineral products and other mining and quarrying reached 64,983, which is higher by 1.7% as compared with 2021.
The majority of employees are in the activity of manufacture of rubber and plastic products, 32,676 (y-o-y growth of 2.2%), whereas the lowest number of employees is in other mining and quarrying, specifically 3,277 (y-o-y growth of 2.6%).
In the total number of employees in the Republic of Serbia, the share of employees in the chemical and rubber industry, manufacture of non-metallic mineral products and other mining and quarrying is 2.9%. The five-year average growth of employees (2018–2022) in the above industries amounts to 3.3%.
Salaries and Wages
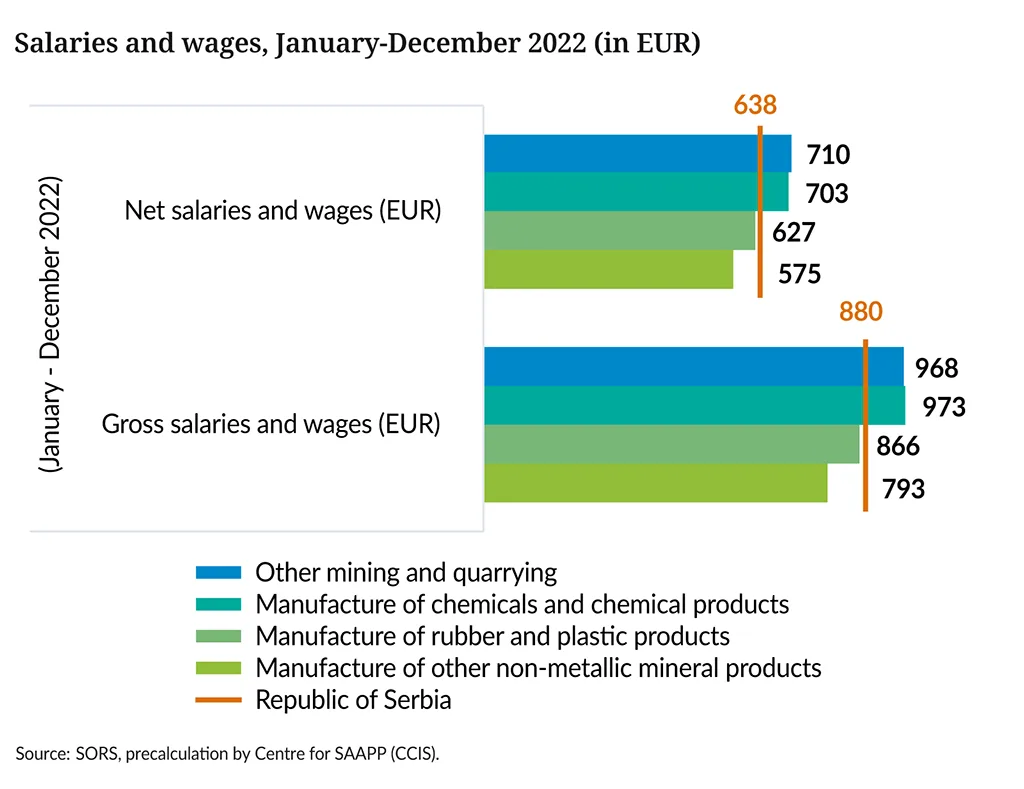
In the period January–December 2022, the average salaries and wages paid out in the Republic of Serbia amounted to EUR 880, whereas the average salaries and wages without taxes and contributions (net) stood at EUR 638. The growth in salaries and wages, in the period January–December 2022, as compared with the same period in 2021, amounted to 13.8% nominally, i.e. 1.7% in real terms.
In 2022, the highest average salaries and wages were paid out in the manufacture of chemicals and chemical products (EUR 973), and they were higher by 10.6% as compared with the average salaries and wages in the Republic of Serbia. In other mining and quarrying, the average salaries and wages are higher as compared with the Republic average by 10.0%, in the manufacture of rubber and plastic products was lower by 1.5% compared with the Republic average, whereas the lowest salaries and wages were recorded in the manufacture of non-metallic mineral products, and they amount to EUR 793 (9.9% below the republic average). The largest increase in the average salaries and wages, in 2022, as compared with 2021, was recorded in the manufacture other mining and quarrying (15.1%) and in the manufacture of chemicals and chemical products (14.7%), while the lowest growth was recorded in the manufacture of other non-metallic mineral products (12.3%). A decline in gross salaries was not recorded in any observed activity of the chemical industry.
Foreign Trade
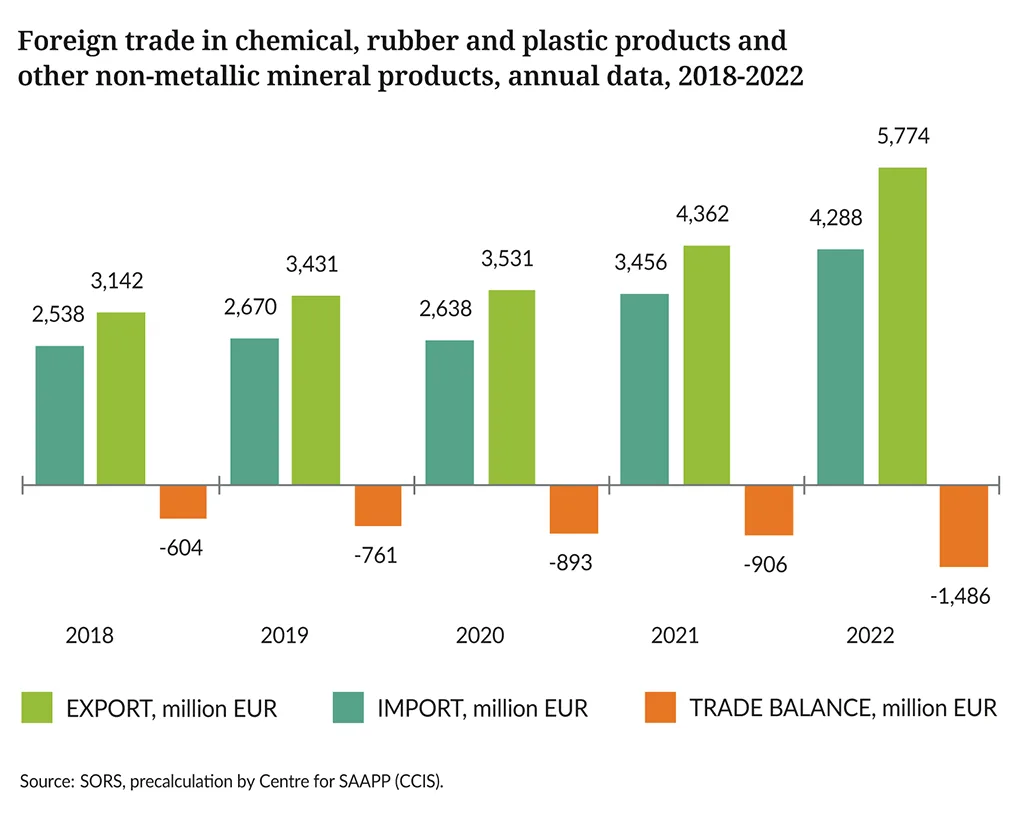
In 2022, the export of chemical, rubber and plastic products and other non-metallic mineral products amounted to EUR 4.3 billion, which was higher by 24.1% as compared with 2021 and, at the same time, accounts for 15.5% of the total goods export of the Republic of Serbia. The average annual export growth rate in the five-year period (2018–2022) amounts to 14.0%.
In 2022, the value of import amounted to nearly EUR 5.8 billion, which is higher by 32.4% as compared with 2021, and accounts for 14.8% of the total import of the Republic of Serbia. The average annual import growth rate in the five-year period (2018–2022) amounts to 16.4%.
The deficit in foreign trade in chemical, rubber and plastic products and other non-metallic mineral products amounted to EUR 1.5 billion, with the coverage of import by export of 74.3%. The highest export was recorded with rubber and plastic products (EUR 2.2 billion), which is higher by 17.4% as compared with 2021, along with the recorded positive foreign trade balance (EUR 660.4 million).
Total Realized Investments
The total realized investments in fixed assets in the chemical, rubber and non-metal industries, in 2021, amounted to EUR 706.7 million, out of which 54.2% was realized in the manufacture of rubber and plastic products (EUR 382.9 million), 21.3% in the manufacture chemicals and chemical (EUR 150.6 million), and 18.8% in the manufacture of other non-metallic mineral products (EUR 132.7 million).
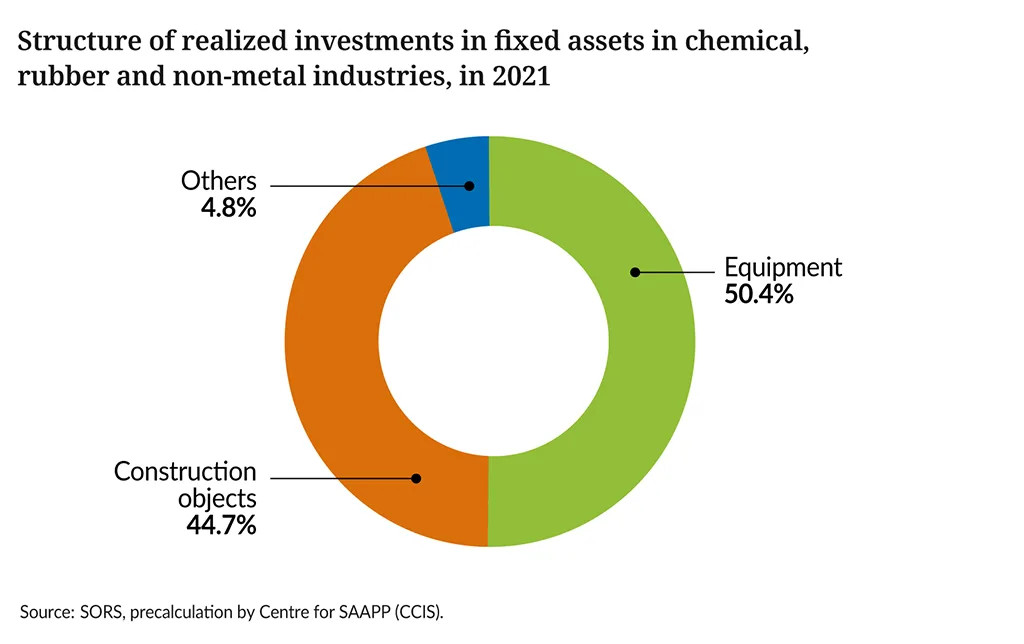
In the structure of these investments, the investments in domestic and imported equipment had the largest share (50.4%). Lower investments were made in buildings and civil engineering (44.7%), whereas the remaining 4.8% accounts for investments in intellectual property – research and development, software, databases and other.
Foreign Direct Investments
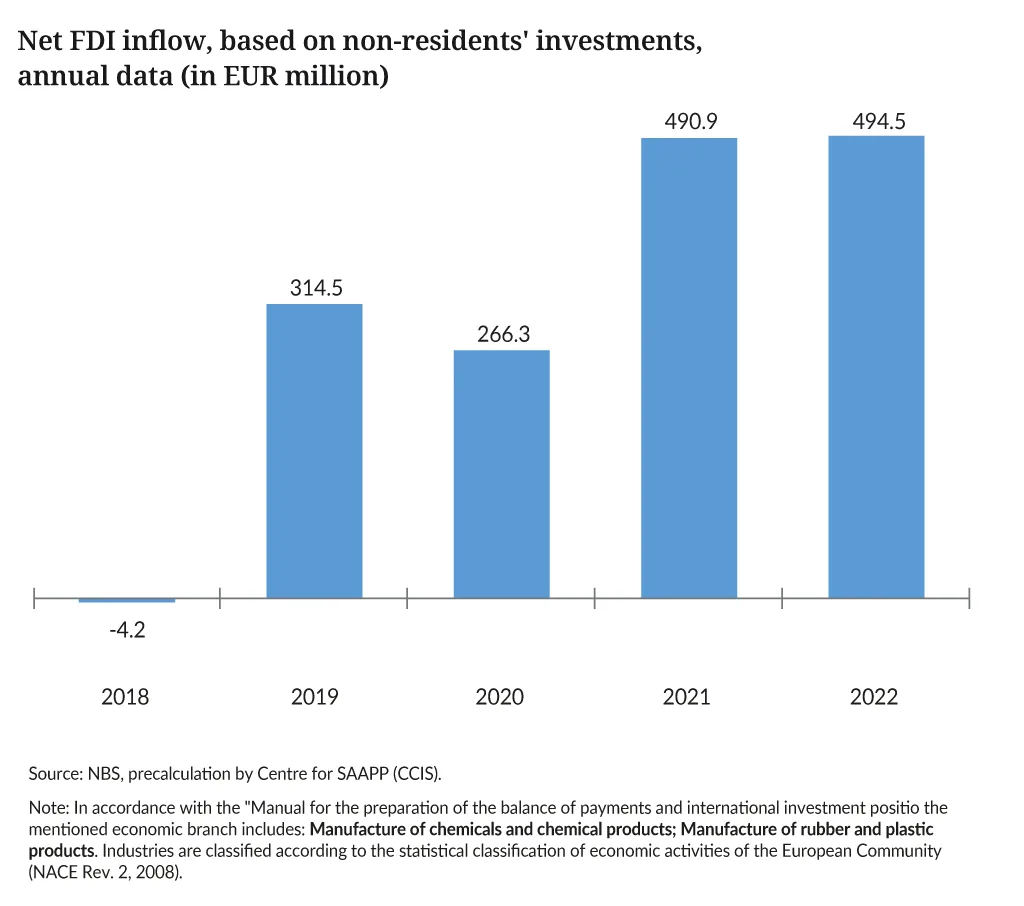
According to the preliminary data of the National bank of Serbia, in 2022, the total net inflow of FDIs in the Republic of Serbia, on ground of investments of non-residents, amounted to EUR 4.4 billion.
In the manufacture of chemicals, chemical products and rubber and plastic products, the net inflow of EUR 494.5 million was recorded, which accounts for 11.2% of total FDIs in the Republic of Serbia. In the manufacture of rubber and plastic products, the net inflow of FDIs was recorded on ground of investments of non-residents, in the amount of EUR 482.8 million, and in the manufacture of chemicals and chemical products, EUR 11.7 million.
In the five-year period (2018–2022) the total net inflow of FDIs in the chemical, rubber and non-metal industries amounted to EUR 1.6 billion, and the highest inflow was recorded in 2022.


