


The competitiveness of the European chemical sector remains well below pre-crisis levels (2014-2019 average) driven by weak demand and uncompetitive energy prices. This is particularly an issue for high energy consuming, commodity products and petrochemicals, where China holds a competitive edge due to large-scale production and low production costs. Compared to the USA, European gas prices were three times higher during January-September 2025, keeping European producers at a competitive disadvantage. Since March 2022, the EU27 chemicals business environment has been facing a limited demand and declining business confidence, intensified by geopolitical uncertainty.
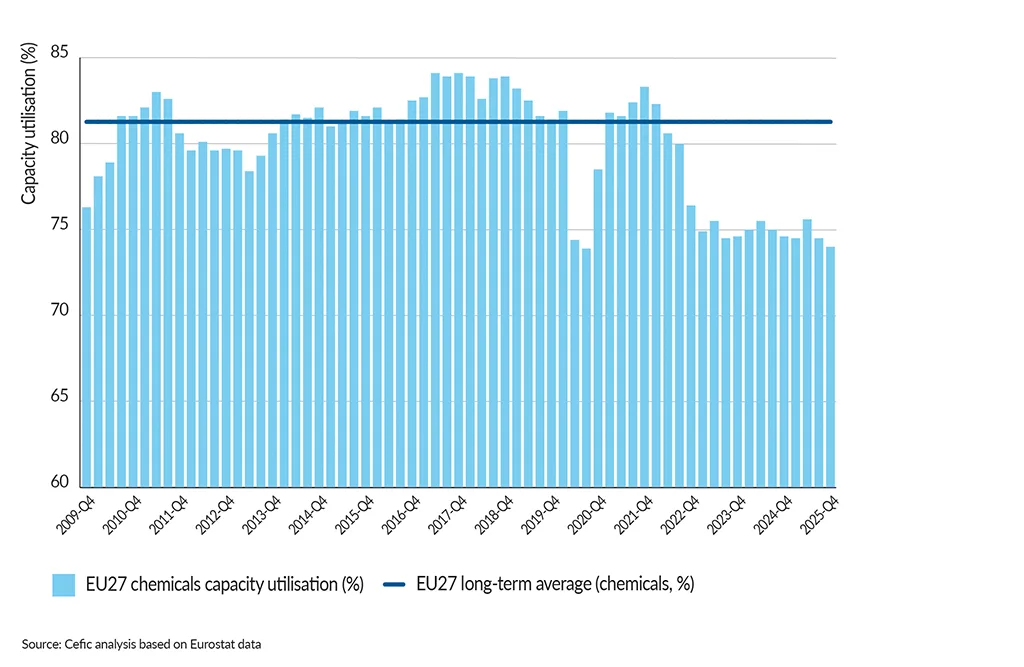
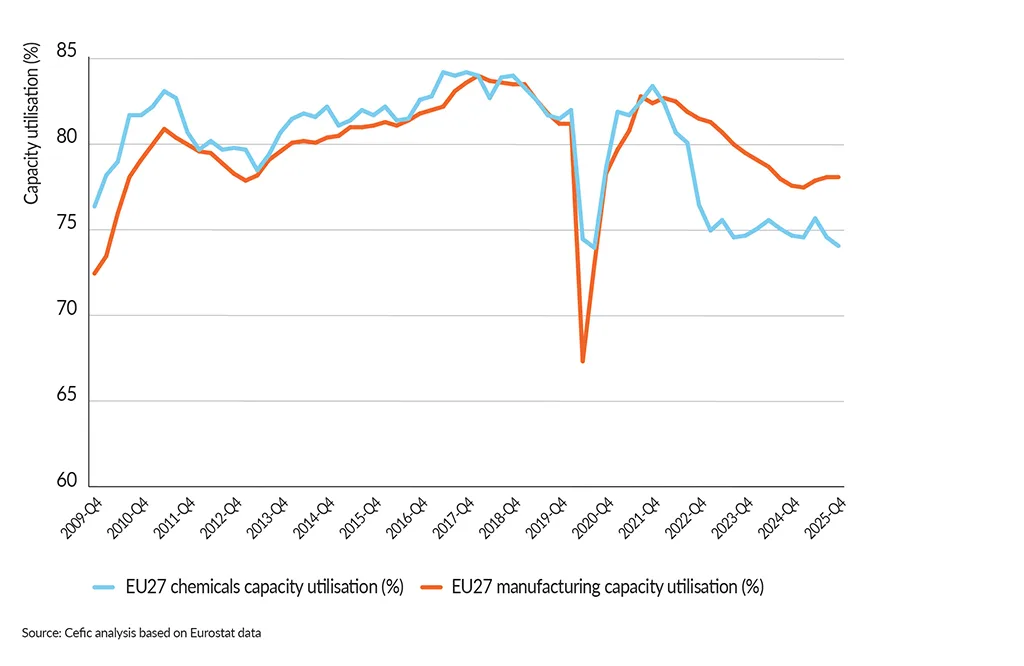
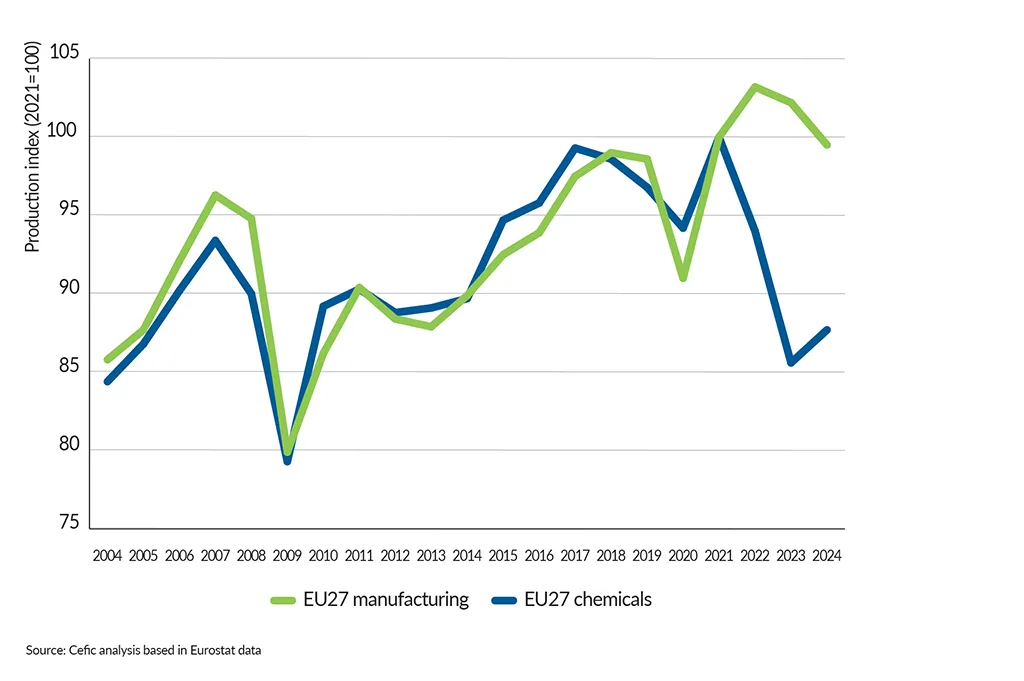
At 74.0% capacity utilisation in the EU27 chemical sector remains a key concern. It has consistently stayed below the EU27’s long-term average since Q2 2022, reflecting ongoing challenges from weak demand and declining business confidence. EU27 chemicals operate at 9.5% below pre-crisis capacity (2014–2019). The output of the EU27 chemical industry remains 10% below the pre-crisis levels of 2014 to 2019. As major supplier of products and technologies to key manufacturing sectors, the European chemical industry needs a strong domestic demand to achieve significant growth. Unfortunately, no strong positive changes have been observed so far and business expectations for most downstream users are still not encouraging.
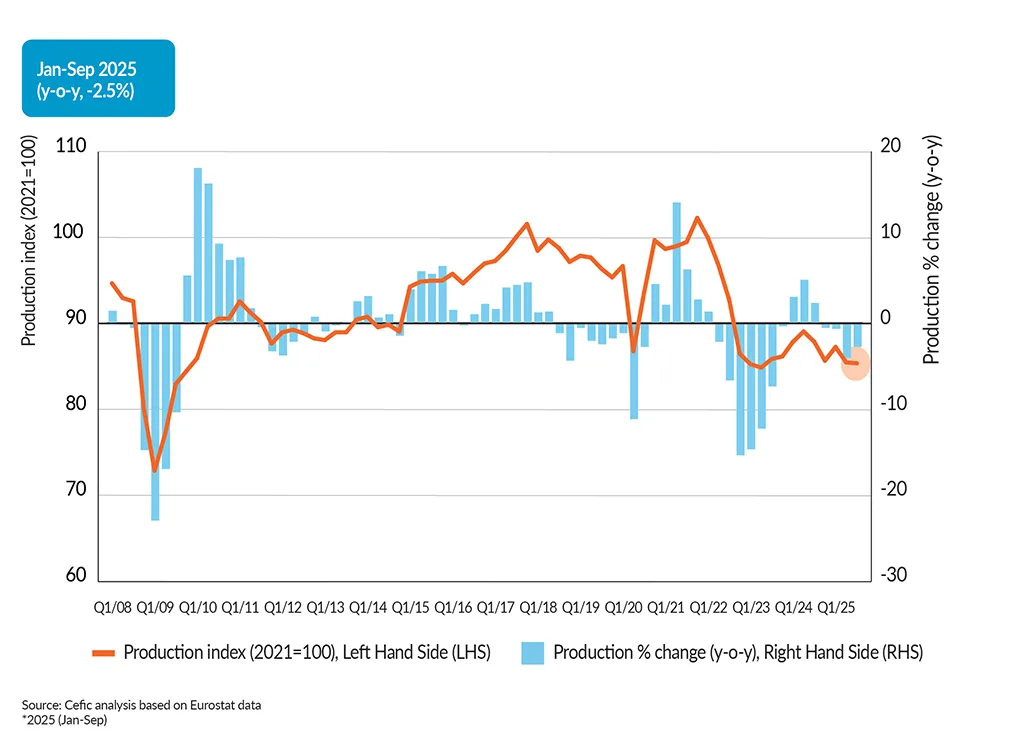
EU27 chemicals output remains a key concern
EU27 chemical output (2008-2025*)
EU27 chemical capacity utilisation remains steadily low (74%)
EU27 capacity utilisation rate (%): Chemicals vs long-term average
EU27 capacity utilisation rate (%): Chemicals vs manufacturing
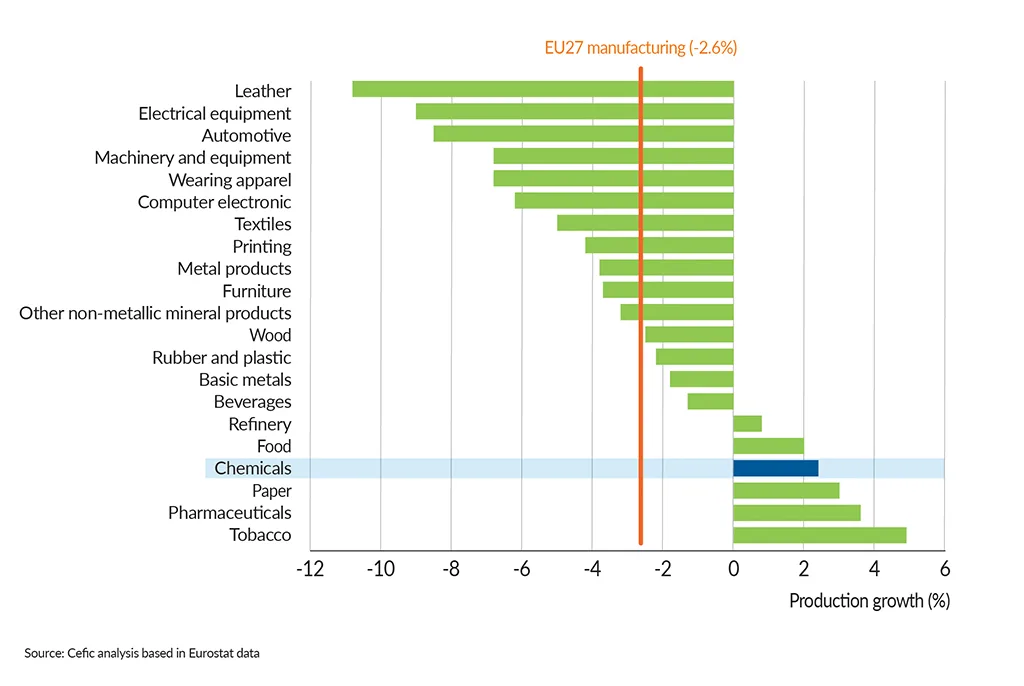
EU27 chemical industry lacks a strong domestic demand
Production growth for EU27 manufacturing sectors (2024 y-o-y)
EU27 producion trend: Chemicals vs manufacturing
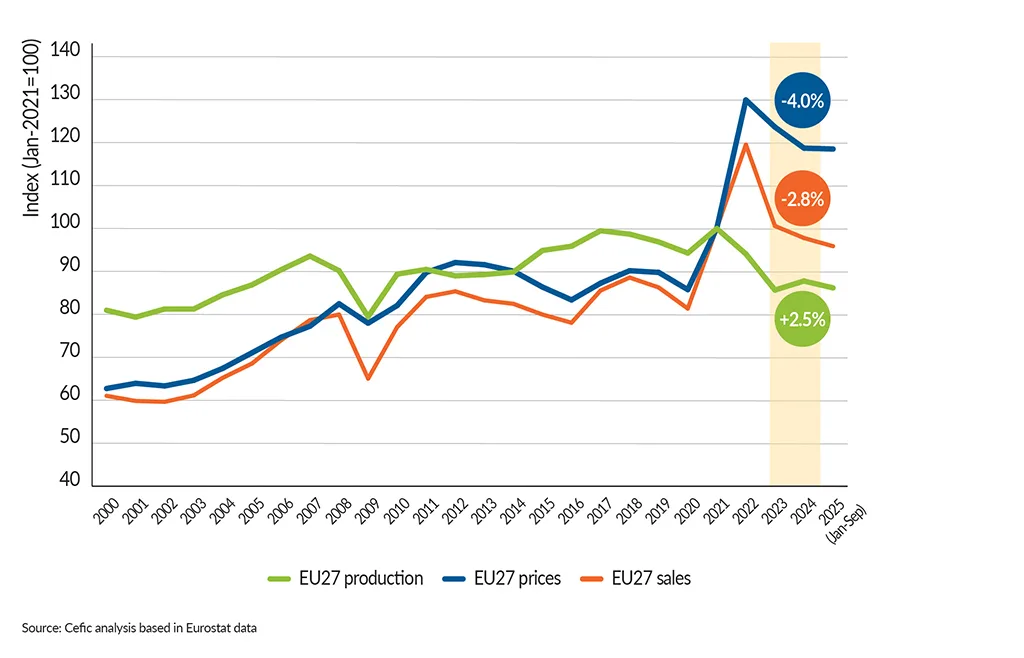
Weak demand continues to weigh on EU27 chemical production
EU27 chemicals : Production, prices and sales
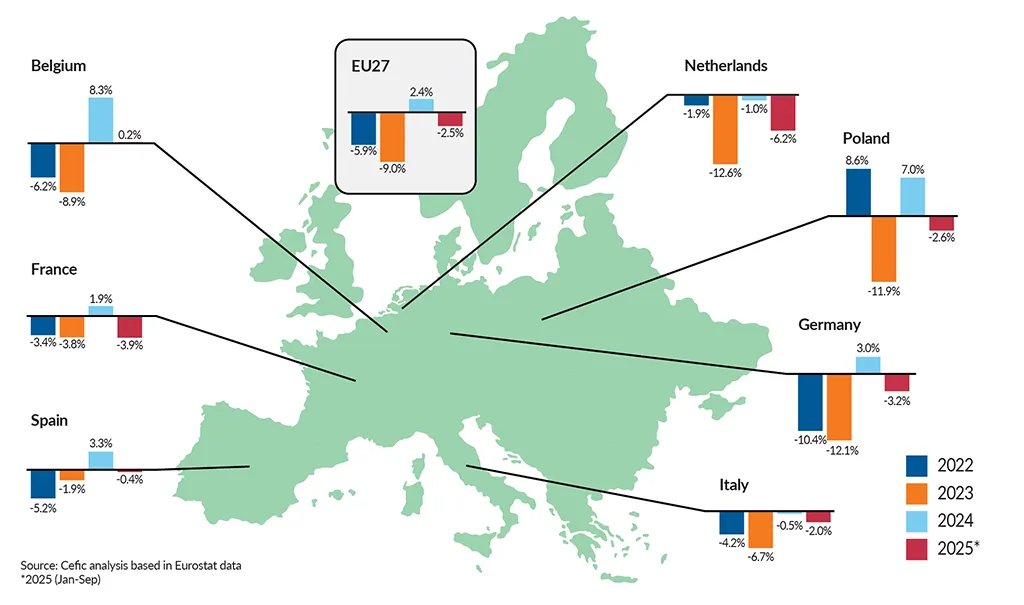
2022-2025*: Different across Europe
EU27 chemicals production growth by country (year over year)
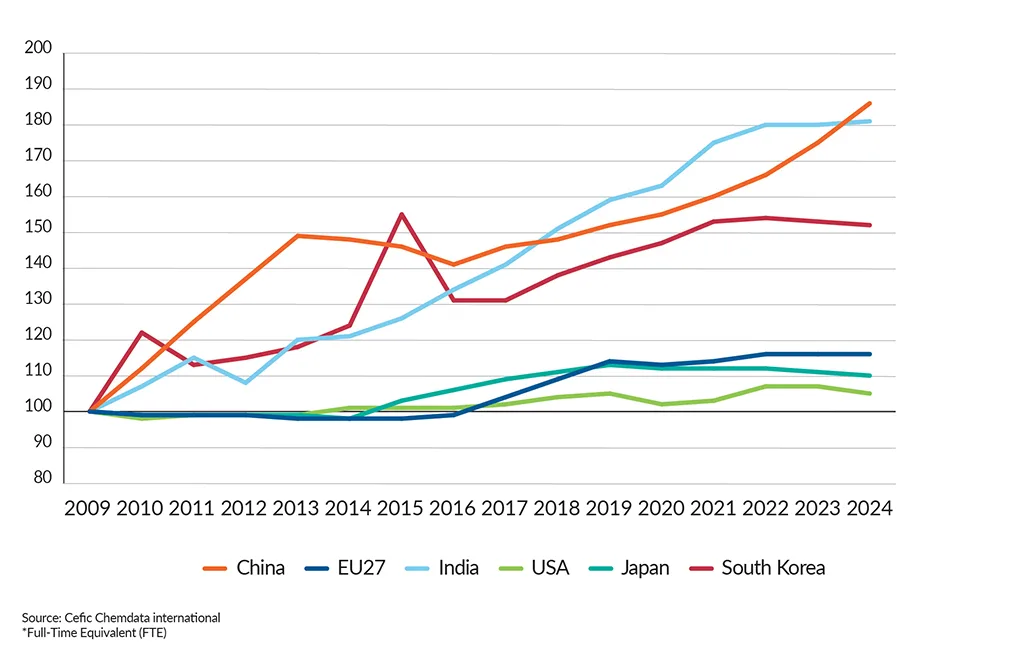
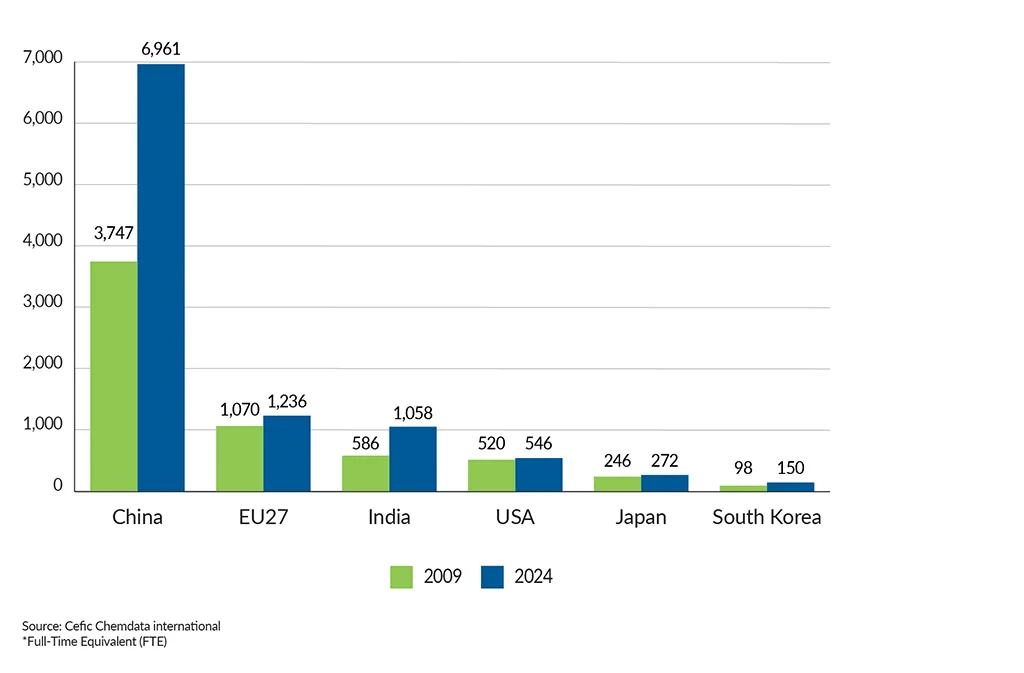
Employment in Europe faces increasing competition from Asia, particularly China and India
Chemical employment* by region, Index (2009=100)
Chemical employment* by region, Index (thousand FTE)
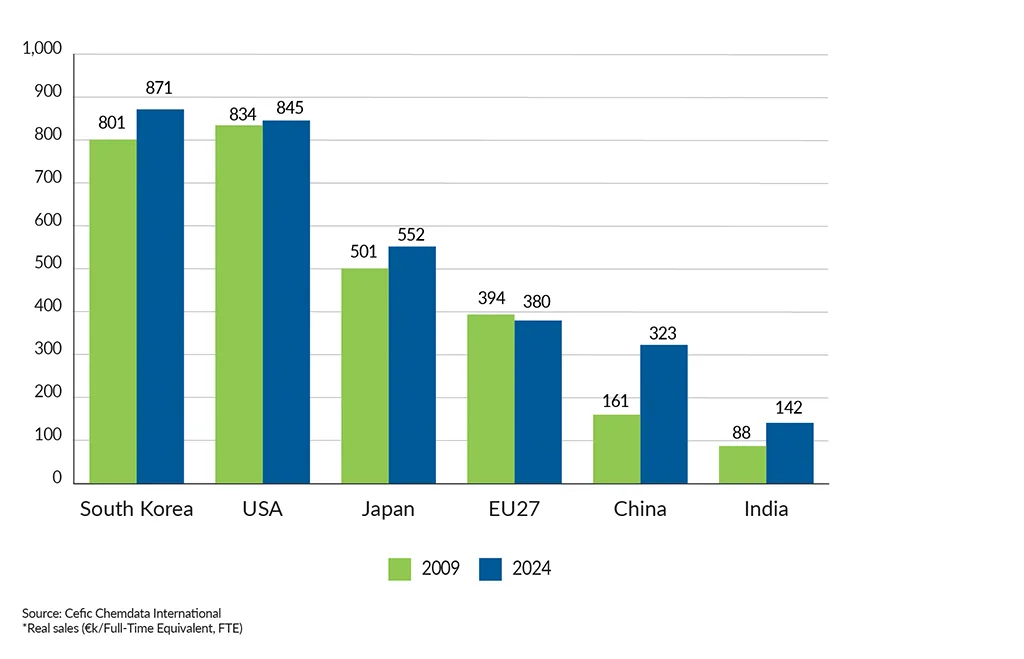
Europe lost labour productivity compared to other regions
Chemical labour productivity* by country, Index (2009=100)
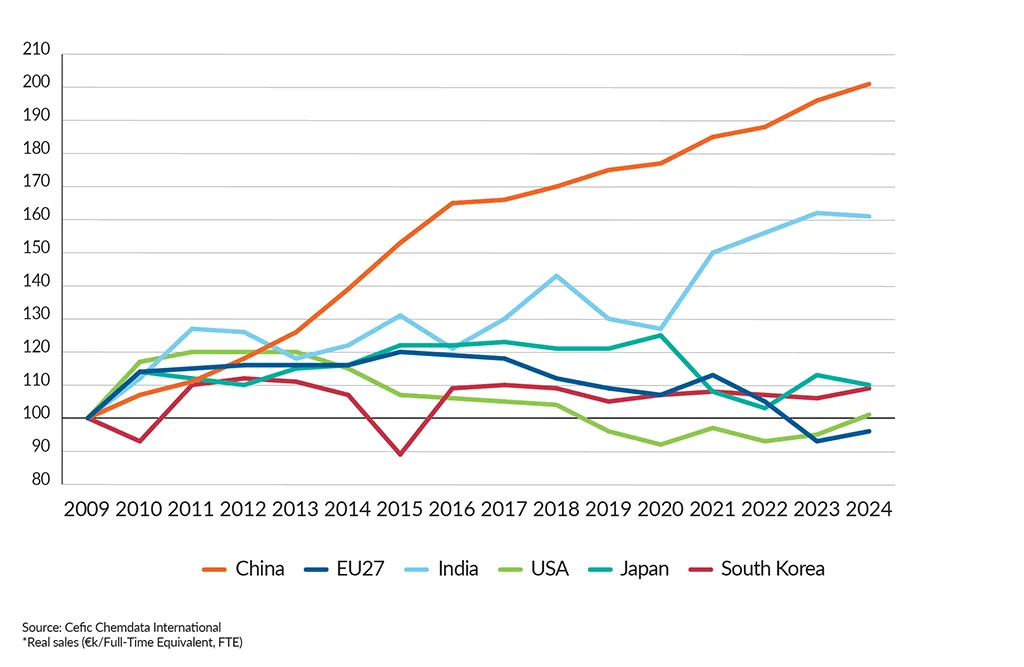
Chemical labor productivity* by country, Index (thousand FTE)