Conserve Resource Efficiency
SDG 12 ‘Responsible consumption and production’ addresses the need to make efficient use of natural resources ensuring sustainable economic growth. Therefore, the chemical industry focuses on alternative designs and continuous improvement leading to improved resource efficiency in the production process, the use-phase, as well as the end-of-life. Improved resource efficiency will be reflected in the way water and waste in the sector are managed, and is also a crucial step towards a circular economy and reduced GHG emissions.
Note that all graphs below are clickable to enlarge.
Contribution to the EU Green Deal
The European Green Deal aims to boost the efficient use of resources by moving to a clean, circular economy, stop climate change, revert biodiversity loss and cut pollution. The chemical industry supports these goals by focusing on efficient use and reuse of resources such as water and waste. The latter is in line also with the EU waste policy which aims to contribute to the circular economy by extracting high-quality resources from waste as much as possible.
Prevent and minimise hazardous and non-hazardous waste
Resource efficiency of production processes, gaining economic as well as ecological benefits, is also reflected in the amount of waste produced. Waste prevention has been, is and will remain a priority within the chemical industry, and increased attention is given to stimulating reuse and recycling, both important steps towards a successful circular economy.
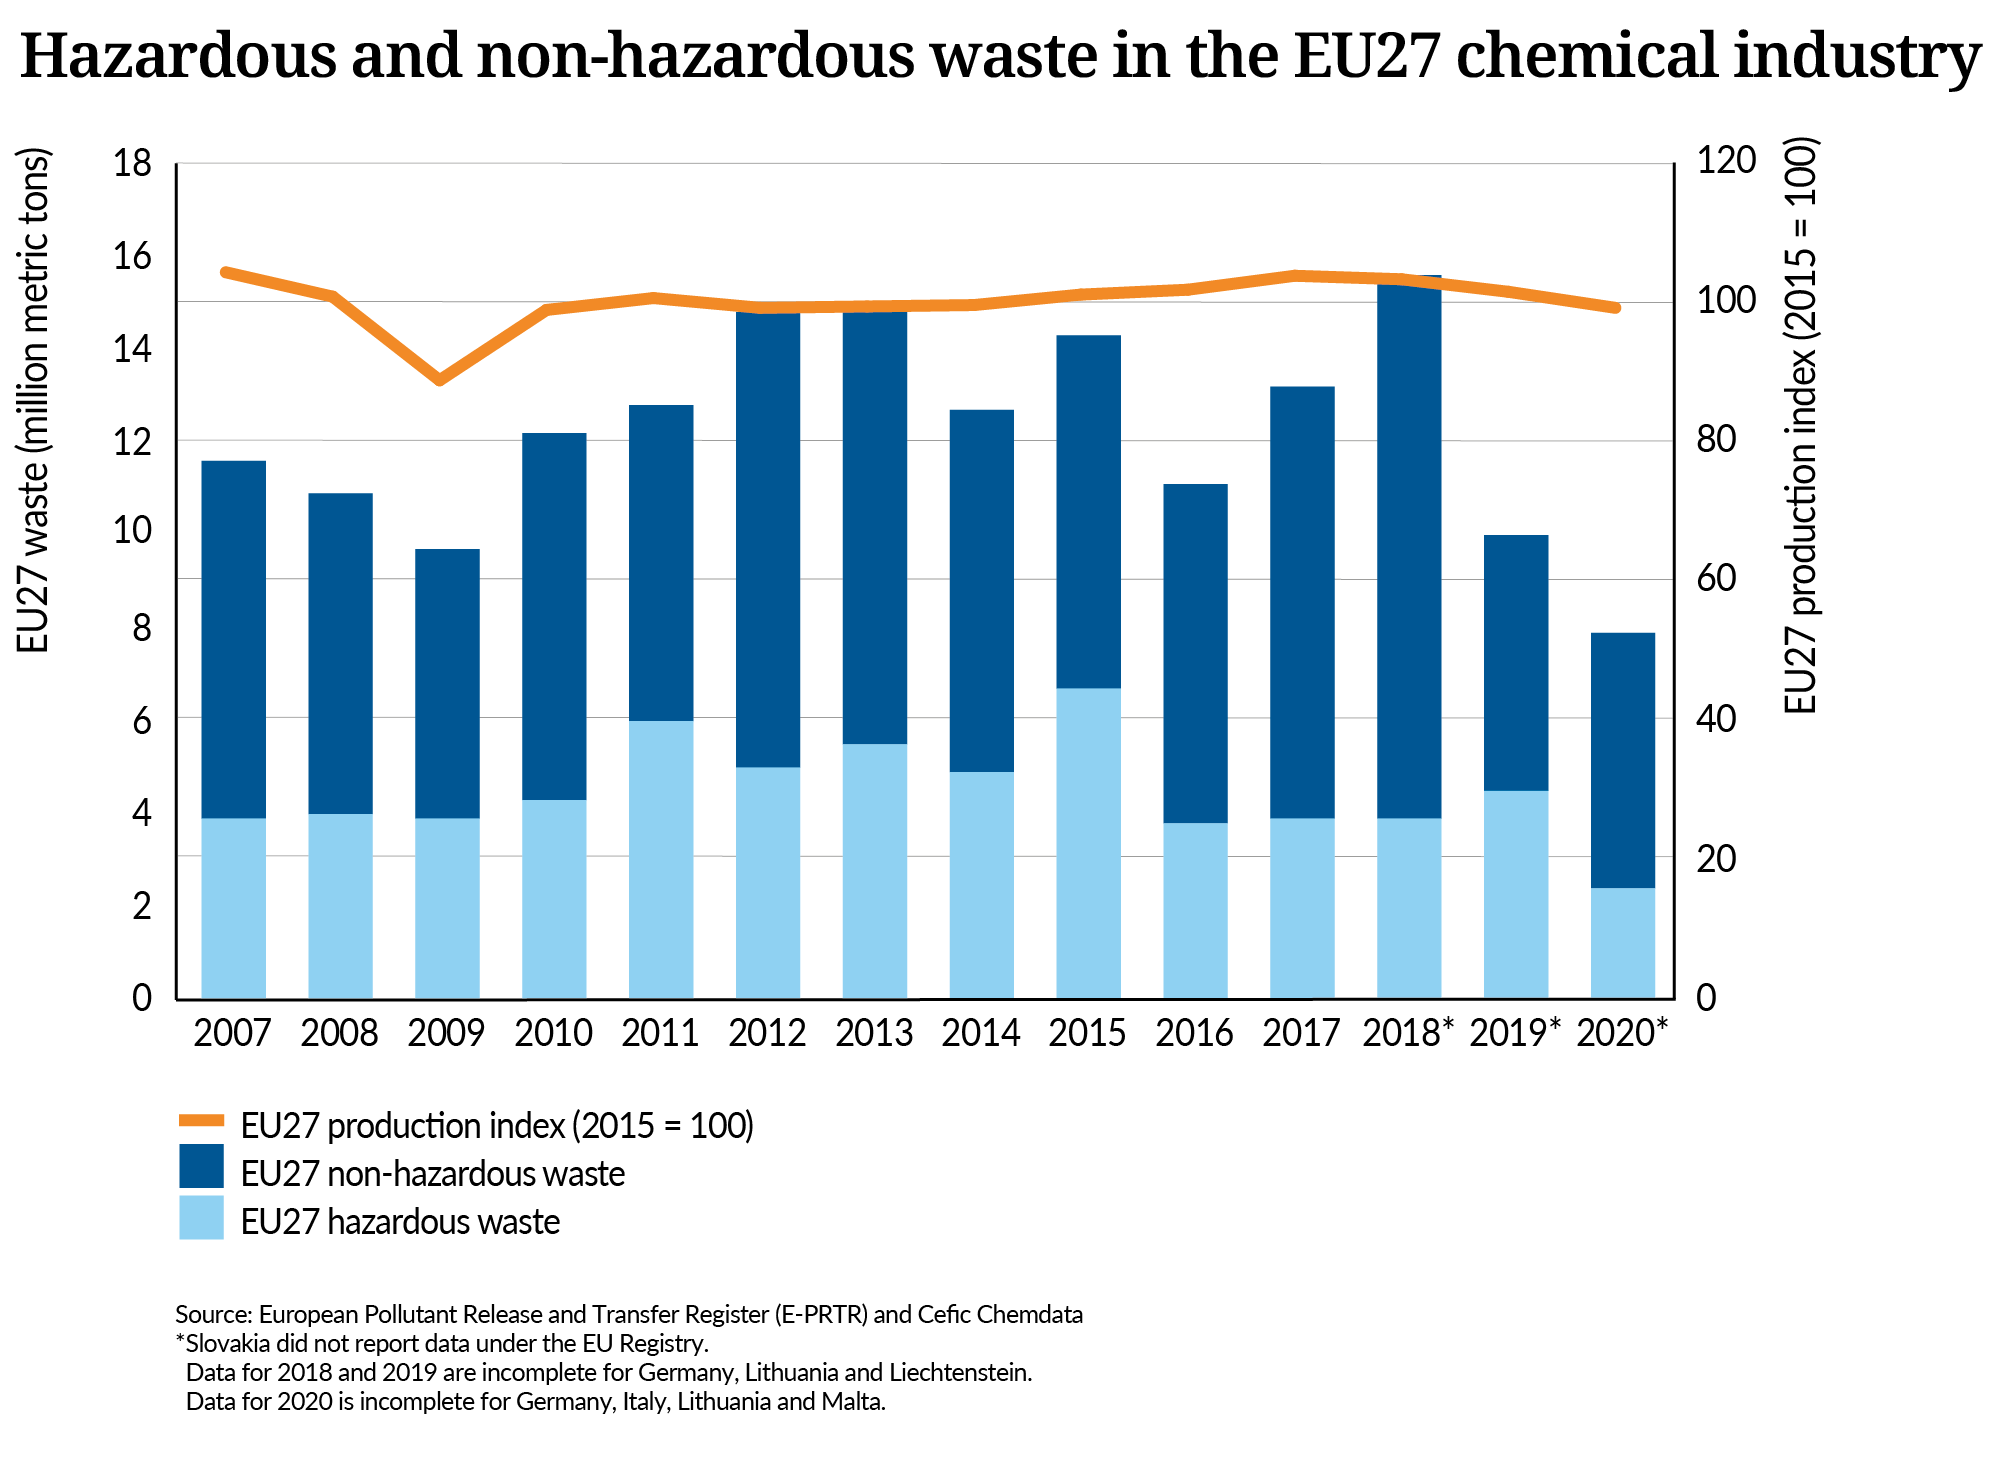
Hazardous and non-hazardous waste generation and treatment: disposal and recovery
The total amount of industrial waste generated by the chemical industry varies between 8 and 18 million metric tons, 25 to 50% of which is hazardous waste. The global economic recession in 2008-2009 resulted clearly in a reduced amount of waste. This amount increased over the period 2009-2013. The lower amount of waste generated in 2014 till 2016, alongside an increase of the production index, suggests a further improvement of the resource efficiency, but this trend did not continue as considerable amounts of mainly non-hazardous waste were reported in 2017 and 2018. Data for 2018, 2019 and 2020 are not completely reported in the E-PRTR yet.
Hazardous and non-hazardous waste over the production index
Recovered fraction of (non) hazardous waste
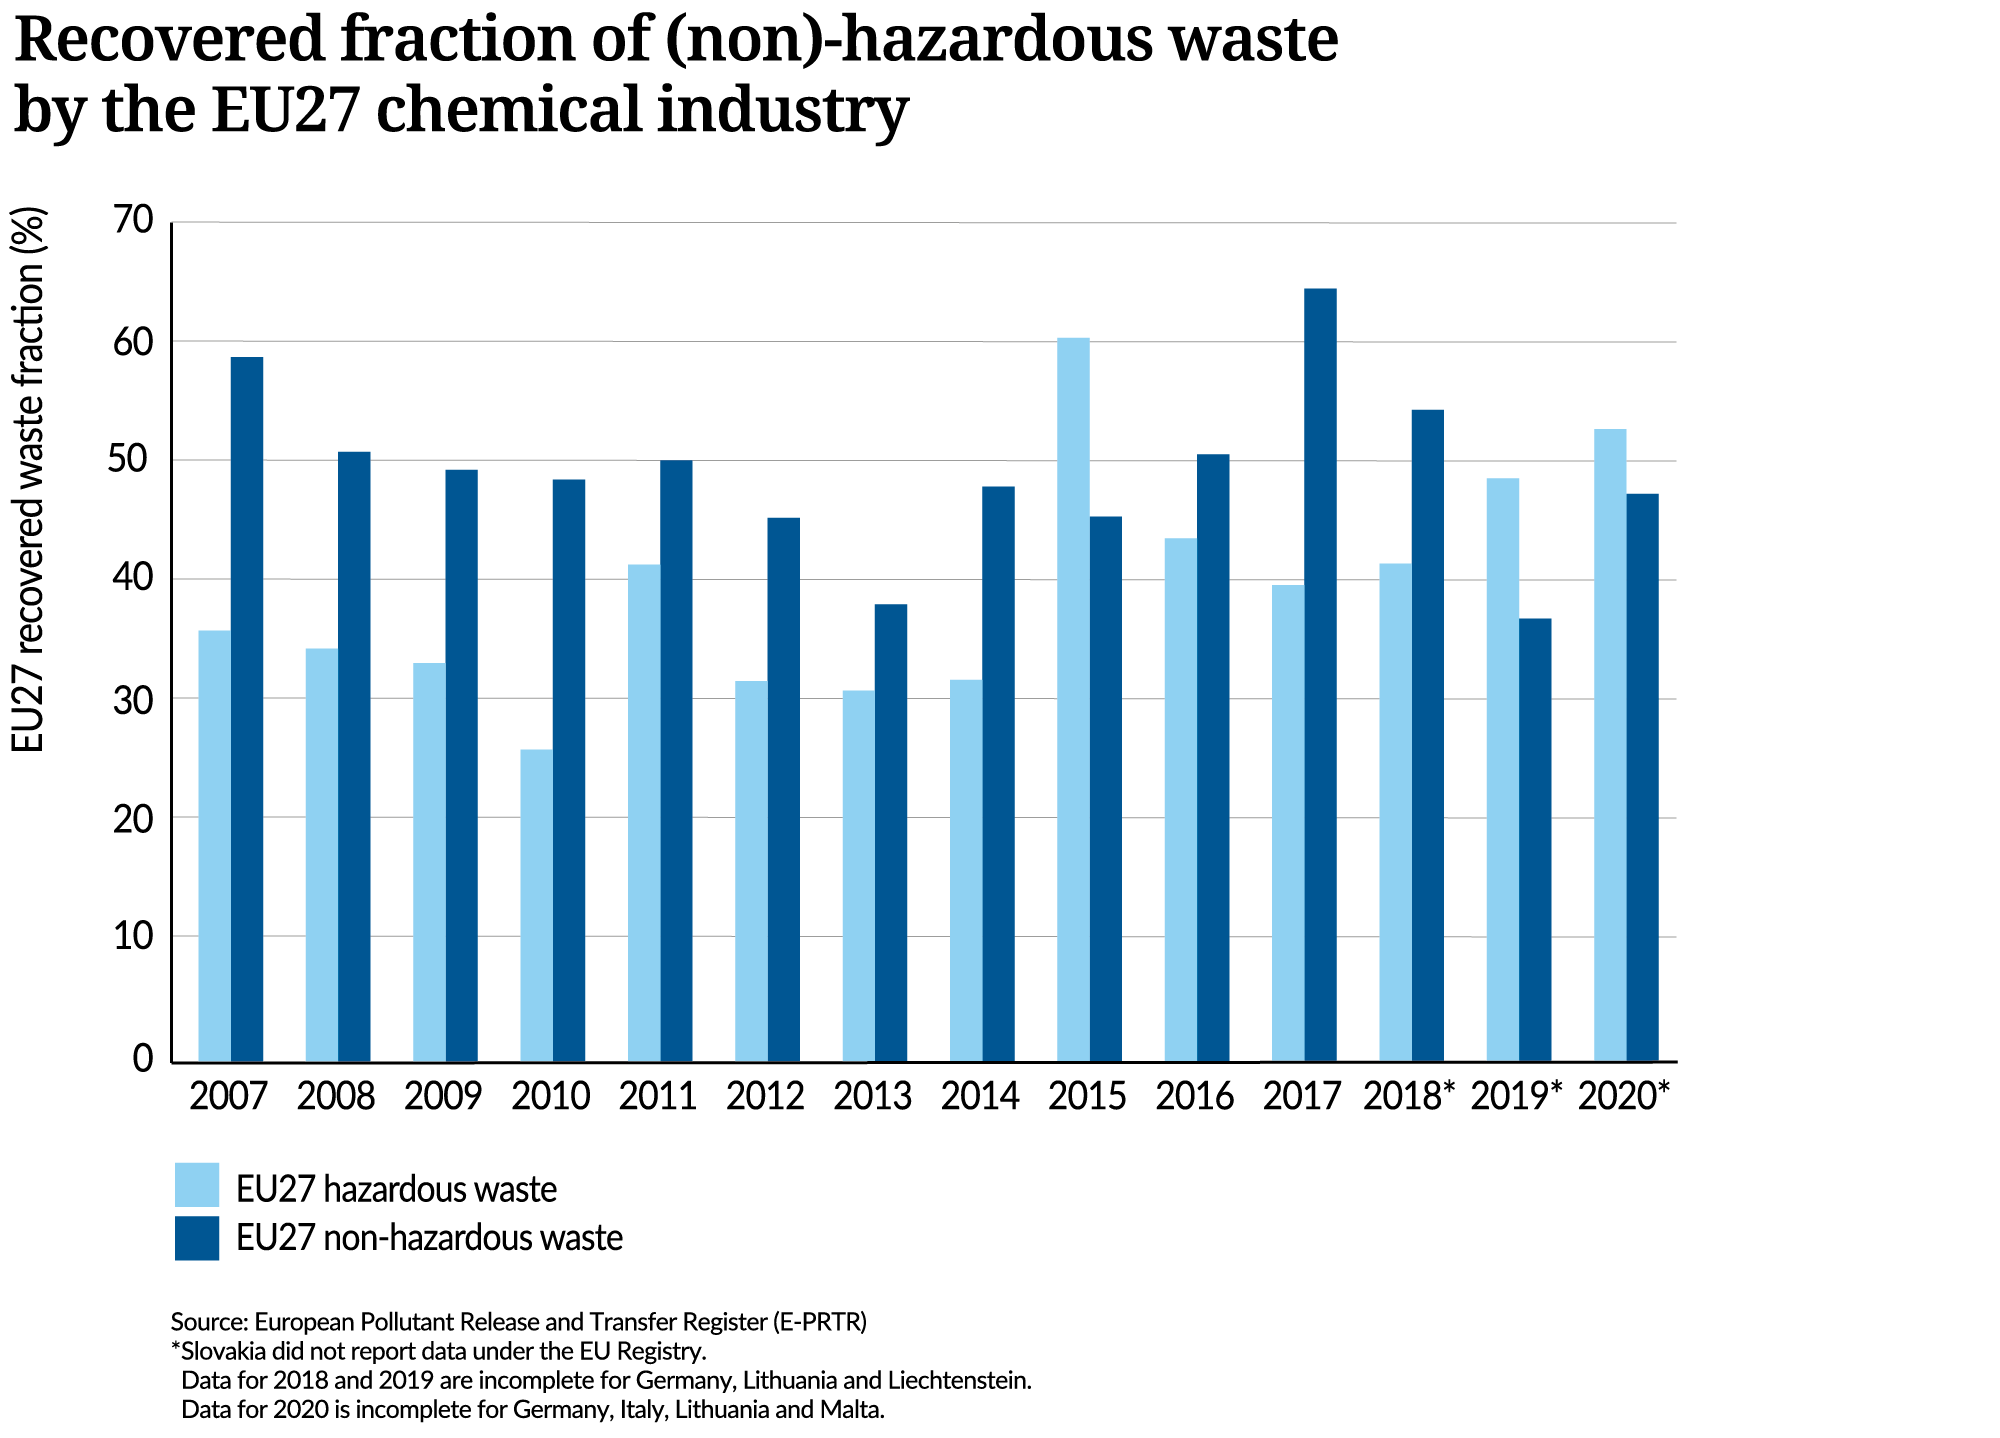
The recovered fraction of hazardous and non-hazardous waste have been fluctuating between 2007 and 2020 without a clear trend. The recovered waste includes a wide range of treatment including waste that is reused, recycled and incinerated with energy recovery. The fraction that has not been recovered was disposed.
Key levers for industry activity & company examples
1. Management of residuals and by-products
2. Increase innovation in recycling technologies & re-use of products to feedstock
3. Following the principles of a waste hierarchy system
4. Increase prevention of waste production
5.Improving resource efficiency continuously
Associated SDG targets
© Reserved copyrights UN SDGs